Digital Evangelism
  • Home
    • Big Data
    • Social Media
  • BLOG
  • RESOURCES
    • RESOURCE MENU >
      • ADVENTIST IDENTITY GUIDELINES
      • BIG DATA RESOURCES
      • BRANDING, IMAGE & DESIGN RESOURCES
      • CHURCH/MINISTRY SPECIFIC RESOURCES
      • COPYRIGHT & TRADEMARK BASICS
      • COURSES
      • EMAIL RESOURCES
      • GUIDANCE FOR HIRING SOCIAL MEDIA POSITIONS
      • PODCASTS
      • REPORTS & CASE STUDIES
      • SOCIAL MEDIA RESOURCES
      • (SOCIAL) VIDEO RESOURCES >
        • HOW TO START A VIDEO MINISTRY
      • TEXTING 4 CHURCHES
      • TRACKING & ANALTYICS
      • WATCH VIDEOS & TUTORIALS
      • WEBSITE TIPS
    • SOCIAL MEDIA GUIDELINES
  • SEO
    • SEO TERMS
  • Digital Discipleship & Evangelism
  • COVID-19 RESOURCES
  • eNEWSLETTER

Blog

#DigitalEvangelism

The Basics of Data Tracking & Analytics

6/1/2020

0 Comments


Jamie Jean Schneider Domm

Digital Strategist, Social Media + Big Data, North American Division

Basics of Data & Tracking Image
If you can track it, you can measure it. As a result, you can gain a better understanding of your audience and their behavior, helping you adapt your strategies to more effectively reach them. Taking the time to review the performance of your digital communications and platforms enables you to better understand what is working and what needs to be changed, which empowers you to shape your digital communications strategy based on data. In the long run, this will save both time and money while maximizing impact.

Avoid data paralysis

Time is valuable. Don’t get so caught up in the details of the data that you respond too late and miss an opportunity. Aim to stay ahead of the curve and be proactive instead of reactive in your strategies.

Most ministries and churches do not have the luxury of a dedicated analytics team, but you don’t need to dive too deep to get valuable information about how your website and campaigns are performing. Since most ministries are new to digital communications and analytics, we’re going to stick to a high-level overview. Go back to those key performance indicators we discussed in the strong foundations section, and use those as a guide for what to track based on your ministry’s goals.

Take the time to familiarize yourself with the terminology of the various data points. Most analytics tools define their terms within the platform. You can usually access these definitions by hovering your cursor over the question mark next to the data category.

The data that is most important to your efforts will be:
  • Website performance data
  • Social media platform analytics or insights
  • Social advertising performance reports

Compare the information you find to the performance goals and metrics you established. Always look for areas of improvement and adjust accordingly.
Communicate with everyone involved by:
  • Sharing report summaries with your team (both good and bad)
  • Creating summary reports for management, committees or boards; keep detailed reports for yourself
  • Problem-solving as a team; sometimes the best solutions are found outside your industry/department/specialty

Use trackable links (a.k.a. UTM codes)

​UTM codes are segments appended to a URL that enable data platforms like Google Analytics to record information about website visitors and traffic sources. This is vital for social media managers as it enables you to measure and prove social media success or, alternatively, identify problems and adjust your strategies. Creating trackable links is surprisingly easy to do and will give you valuable insights into how well your digital communications and ads are performing.

What is a UTM code?
UTM = Urchin Tracking Module
Example: https://www.SDAdata.org/?&utm_campaign=DigitalGuide-2020&utm_source=Social-Media

UTM codes can be used in links shared via:
  • Social media posts
  • Email
  • Online ads
  • Websites
  • Any link that drives traffic to your website
 
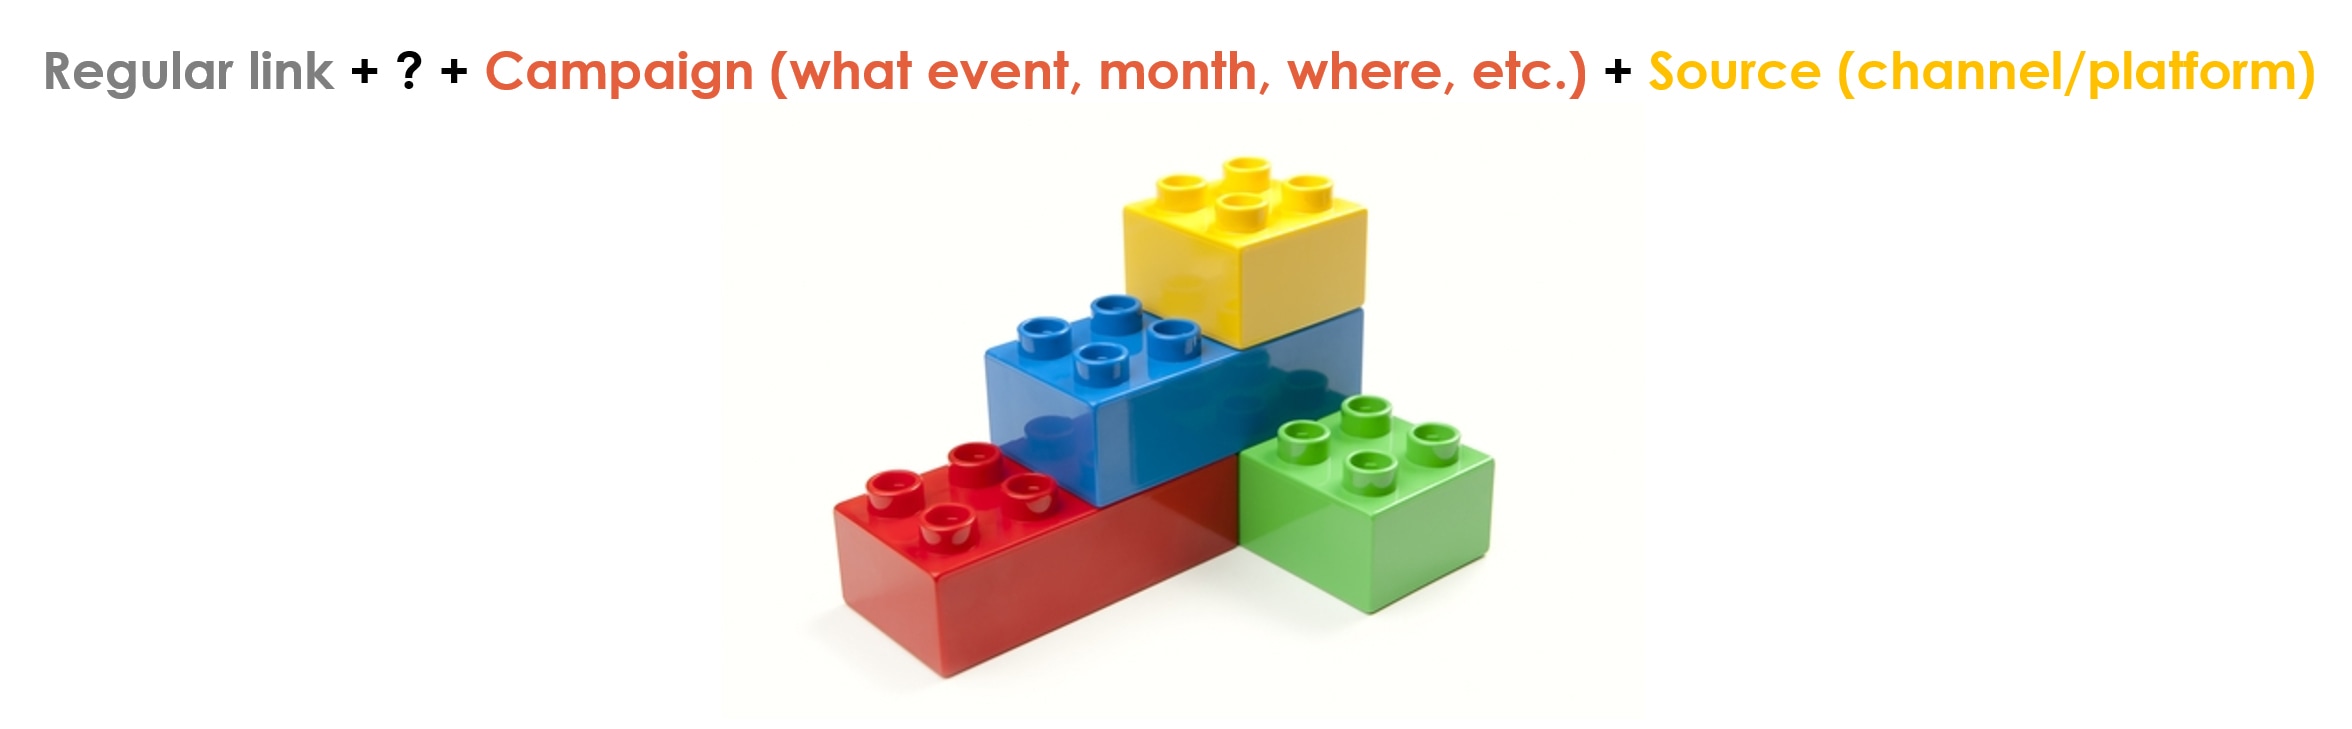
Creating your own trackable links
A trackable link has five building blocks:
  1. The URL you want to direct people to
  2. A ? to signify the start of the UTM code
  3. & + UTM
  4. The name of the promotional campaign the link is related to
  5. The source where the link will be used
 
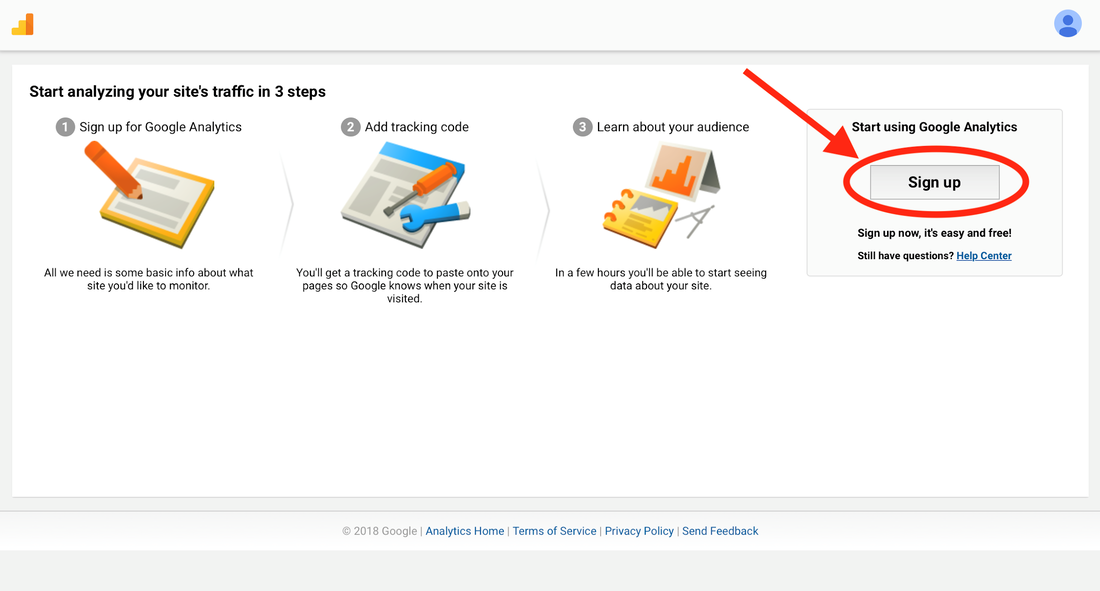
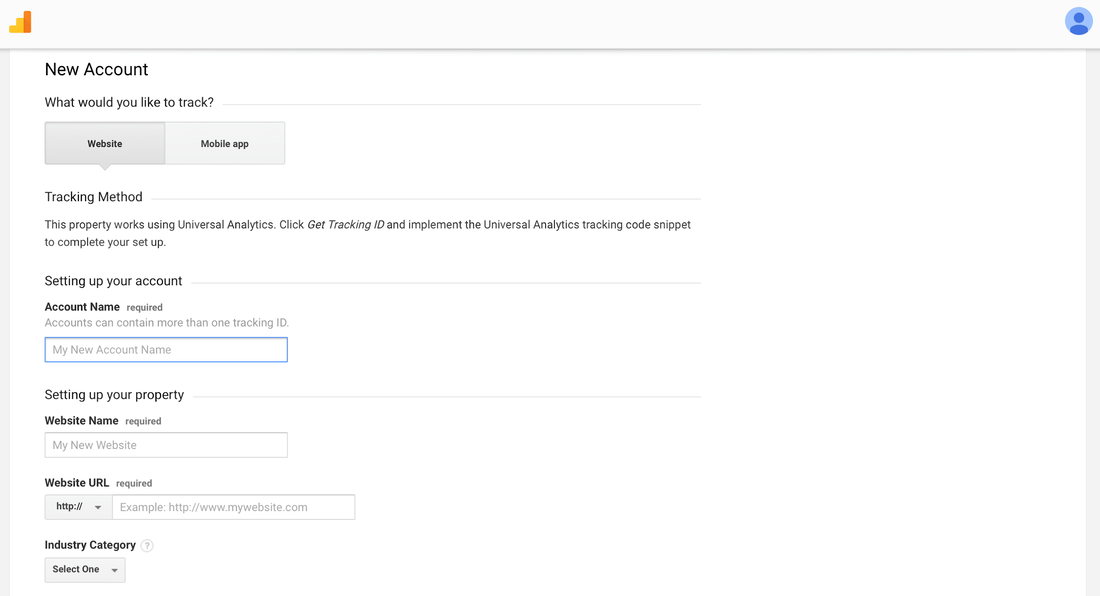
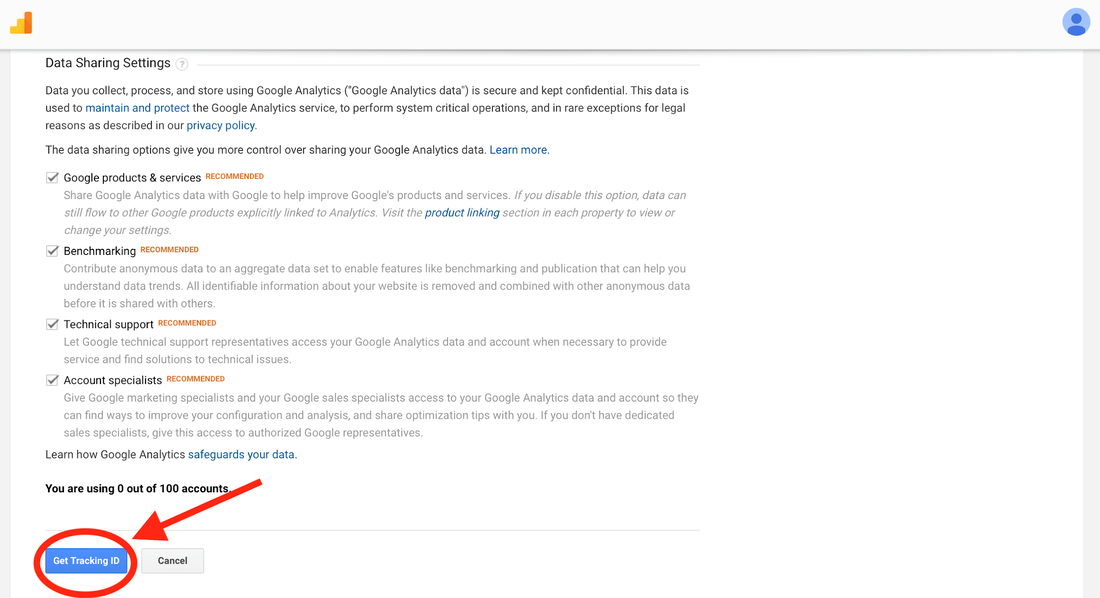
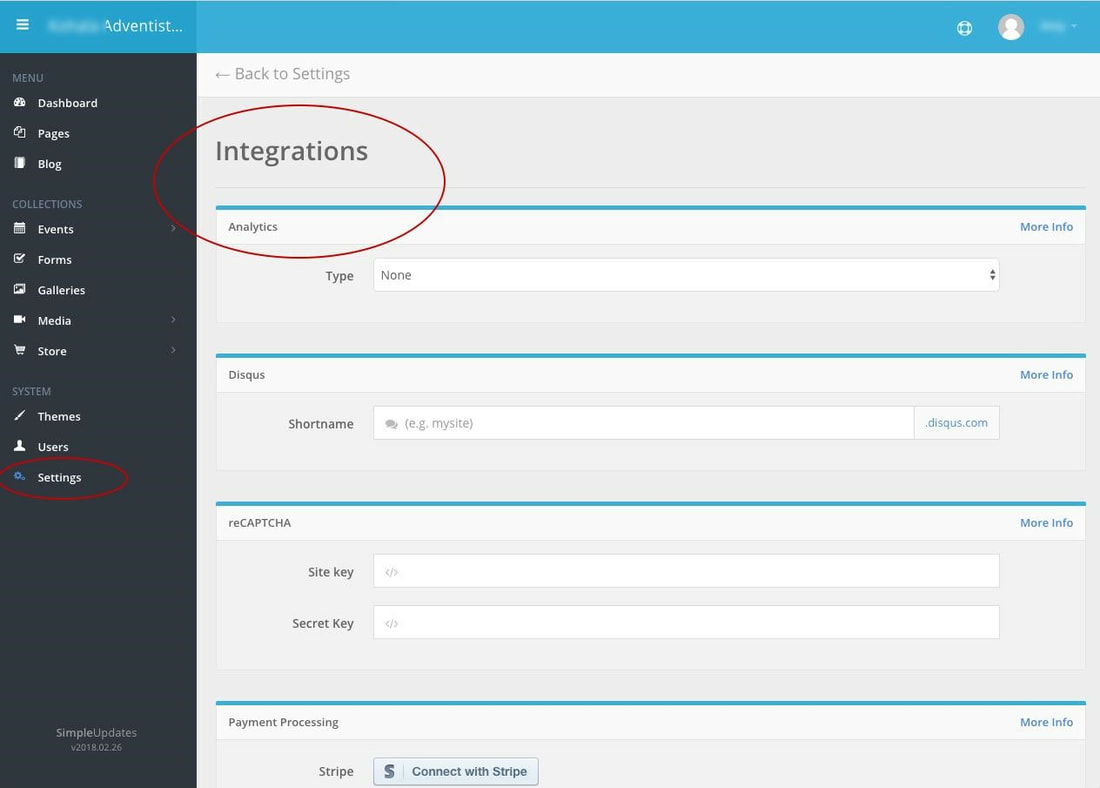
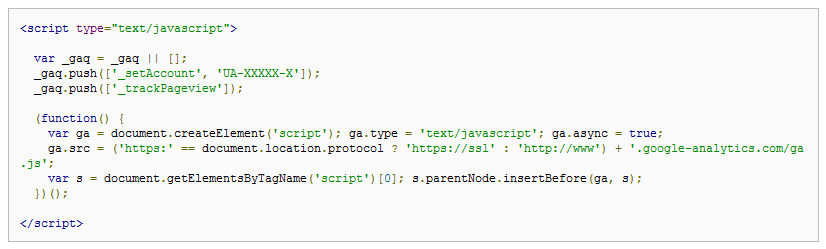
Example:

URL – https://www.sdadata.org/digital-discipleship-and-evangelism.html
Campaign – DigitalGuide-2020
Source – Social-Media

Put it all together using this formula:
Regular link + ?&UTM + Campaign (what event, month, where, etc.) + &UTM + Source (channel/platform)

Final result:
https://www.sdadata.org/digital-discipleship-and-evangelism.html?&utm_campaign=DigitalGuide-2020&utm_source=Social-Media

Be sure to always test your links!
After you create your trackable link, be sure to test it to make sure it works. It can be very frustrating for your audience to receive digital content with a broken link.

Website performance data

The most common analytics tool for detailed website performance tracking is Google Analytics. Google Analytics is a free tool for monitoring where your visitors come from and understanding how they interact with your website. It’s easy to set up a free Google Analytics account. Most website hosting platforms offer easy-to-follow directions to get you started. Once you are set up, take the time to familiarize yourself with the tool and make it a habit to check your website’s analytics each month.

Terms and definitions
  • Session: A visit to the website during which the user is active
  • Users: Number of unique people who have visited your website during a specific time frame
  • Page views: Total number of pages viewed; repeated views of a page by a single user are counted
  • Page/session: Average number of pages viewed during a session
  • Average session duration: Average length of a session
  • Bounce rate: The percentage of single-page sessions in which there was no interaction with the page

Key metrics to monitor
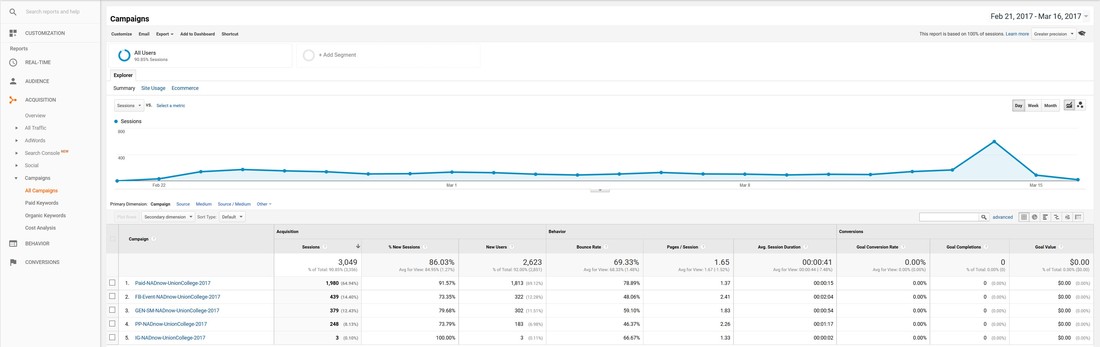
  • Demographics: Age and gender
    Known data about your website visitors.
  • Geo: Location
    You can see location by country, city, state, and metro area. You can also look at language if that is relevant to your ministry.
  • Behavior: Site content – pages
    Here, you can determine your most popular and least popular pages.
  • Behavior: Engagement
    Length of visit/depth of visit.
  • Acquisition and traffic sources
    As communicators, we want to know what is working and what is not working to drive people to our website.

The channel (or traffic sources) breakdown
  • Other = UTM codes or campaigns
  • Direct (visitors typed in the URL)
  • Social media (no tracking code)
  • Referral from another website
  • Search engine (e.g., Google, Bing, etc.)
  • Paid search (results from Google Ads)

Campaign performance

When you drill down deeper under campaigns, you can learn what aspects of a campaign performed the best by using unique UTM campaign names for the different components of your communications strategy. Google Analytics automatically picks up the campaign name and source from the tracking links. There is no need to do anything in Google Analytics to make this work! Just be consistent with the UTM codes you use, and be clear with your campaign and source names.

Remember, prioritize. You don’t have time to track everything, nor do you need to!

Once you have determined what you’re going to track to determine whether or not you’re reaching your goals, check performance monthly, and record your results in a way that enables you to see trends over time. Some analytics tools like Google Analytics allow you to create dashboards for easy access, while social media insights may require that you create your own charts and graphs. To learn more about Google Analytics, check out our beginner tutorial on SDAdata.org.

Social media analytics or insights

Most social media platforms offer at least basic insights into the performance of a ministry’s account and who their audience is. Take the time to familiarize yourself with the analytics for your social media platforms and regularly check them to understand trends over time.

Pay particular attention to:
  • Demographics. Who follows/likes your page by location, age, gender, and language.
  • Engagement. This includes comments, likes, shares, messages, video views, etc. If you’re creating content that resonates with your audience, you should expect to see strong engagement rates.  
  • Video views. A more reliable metric for gauging success than number of views is how many minutes are spent watching your videos and the number of thru plays. Many platforms count a few seconds of watch time as a view, so the number of views can be misleading. 
    ​
Peak visit/engagement periods. Knowing when your profile traffic peaks and when your audience is most likely to engage with your content will enable you to schedule your content strategically. 

Social advertising performance analytics

After you place your ads, don’t wait until the campaign is over to check performance. Monitor the ads closely to make changes and optimize as needed. Catch problems early on; otherwise, your money may go to waste. The great thing about social advertising is that you can edit campaigns at any time if they are not meeting your expectations. Make sure you understand what the numbers mean; most platforms have descriptions available in pop-ups next to the column head. 
​
Be sure to:
  • Understand where your ads are appearing and what locations have the strongest results.
  • Determine who you are reaching by age, gender and location. You may find that your ad doesn’t resonate with who you thought it would or that your targeting was off.
  • Monitor engagement/response. Are you getting the results you expected?
  • Test images, messages, and audiences (A/B testing) to learn what type of ad and messaging performs the best with your target audience.
  • Connect performance to Google Analytics and monitor visitor behavior using trackable links.
 
Some basic terminology you should know:
  • Results: The number of times your ad achieved an outcome, based on the objective you selected
  • Reach: The number of people who saw your ads at least once; reach is different from impressions, which may include multiple views of your ads by the same people
  • Impressions: The number of times your ads were viewed
  • Frequency: The average number of times each person saw your ad
  • Cost per result: The average cost per result from your ads
  • Cost per impression: The average cost per impression of your ads
  • Relevance: An estimation of how well your target audience is responding to your ad
  • Click-through rate (CTR): The percentage of times people performed a click after viewing your ad
  • Cost per thousand (CPM): The average cost per 1,000 impressions
  • Cost per click (CPC): The average cost for each click

Track so that you can learn

​Remember, if you’re going to take the time to put together a campaign strategy, take the time to track its performance so you can be better informed next time. There’s no point in testing strategies without tracking your efforts. If you don’t learn from your campaign, you can’t improve the next one. Social media and digital marketing are both an art and a science. Use data to inform your intuition. 
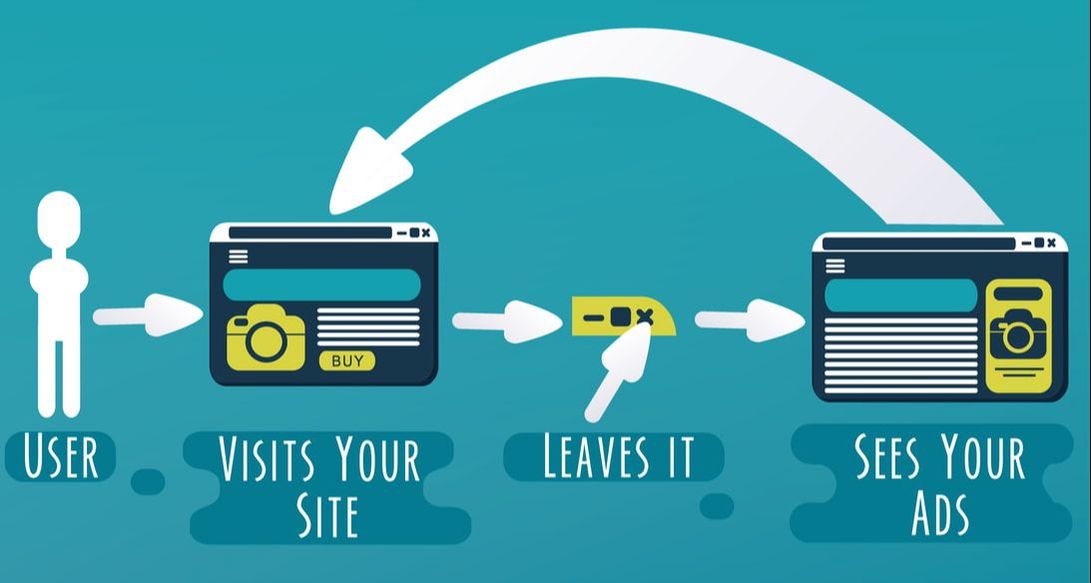
Click here for more on digital discipleship & evangelism
0 Comments

Facebook Marketing 101: Become a Facebook Power User

5/15/2019

17 Comments


Akande Davis

Digital Strategy Specialist and founder of Digital Pew. ​

Facebook Marketing 101: Become a Facebook Power User Picture
There are a ton of social media channels that exist and new ones are sprouting up every day, but the end all be all is the behemoth we know as Facebook and Instagram. Currently, Facebook has roughly 2.06 billion users worldwide, Instagram with approximately 700 million active users every month.

Platforms like YouTube, Snapchat, Tumblr, Twitter and others have huge user bases as well, but the flexibility and powerful marketing features that Facebook is equipping users with has paved a way for in-house marketers and organization leaders to get their message in front of their audience in the most effective way possible.

Now organizations have an incredible opportunity to help lead out and strategize their non-profit’s online marketing campaigns by becoming better users of Facebook.

This isn't to say that a volunteer can replace the resources or knowledge of an agency - if you want professional results, trust and partner with an agency to help you get there -  but rather, for smaller projects, maintaining your online presence and supporting your business or non-profit’s efforts using social media.

Becoming a Facebook Power User also means that you are able to vet the people who you plan on working with and bring your valuable insight to the strategy being developed.

It might take some time, some practice and some studying, but becoming a Facebook Power User is not impossible and with a little bit of sweat equity you can start developing, launching, executing and measuring your own campaigns!
​
Let's get started - the first step is to...

If you have a website or blog, you need to have your Facebook Pixel setup. Having Facebook Pixel setup on your website or blog is as essential as setting up Google Analytics - it's just a must!

Not only you can see incredible insights on how your audience behaves outside of Facebook, but you can retarget the ones who interact with your content more often.

This is excellent for a number of reasons - that's pretty obvious - but often times business and non-profit marketing leaders will miss this crucial step in their strategy and go months, dare I say, years without having any of this information.

Don't miss this step, setup your Facebook Pixel. 

Here is a comprehensive guide on how to do it. 
​

And here is the kind of information you can get from having it live...
Facebook Pixel Dashboard Picture
Complete this step before going ANY FURTHER! (Just trust me on this)

​Explore Your Facebook Page's Insights

By default, Facebook provides Page Administrators (people who own or operate a Facebook Page) a ton of insight into how the page is performing and audience reach at a granular level. With Facebook Page Insights you can not only see how far your Facebook Page reaches, but also when your audience is the most engaged, what kinds of content they like the most and more. 
​
Your Facebook's Page Summary dashboard for example provides a bird's eye view on what is going on with your Facebook page. You can see how many Actions, Page views and Page Likes are happening as well as how far your posts are getting to your audience (Post Reach).
Facebook Page Summary
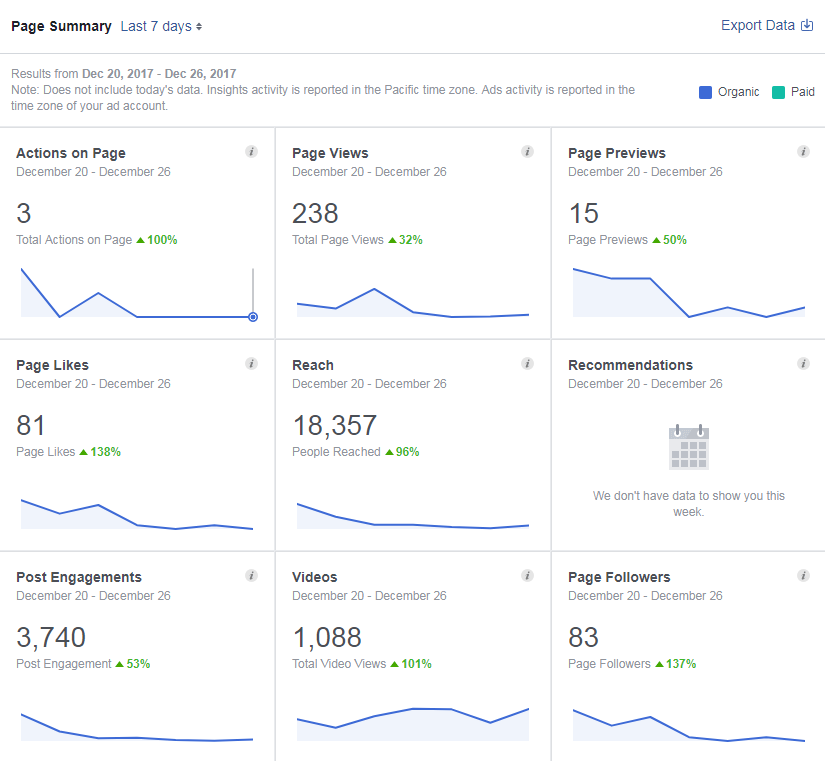
Your Facebook Page Summary gives a detailed look over all of the activity across the board for your page.
Facebook Insights Snapshots
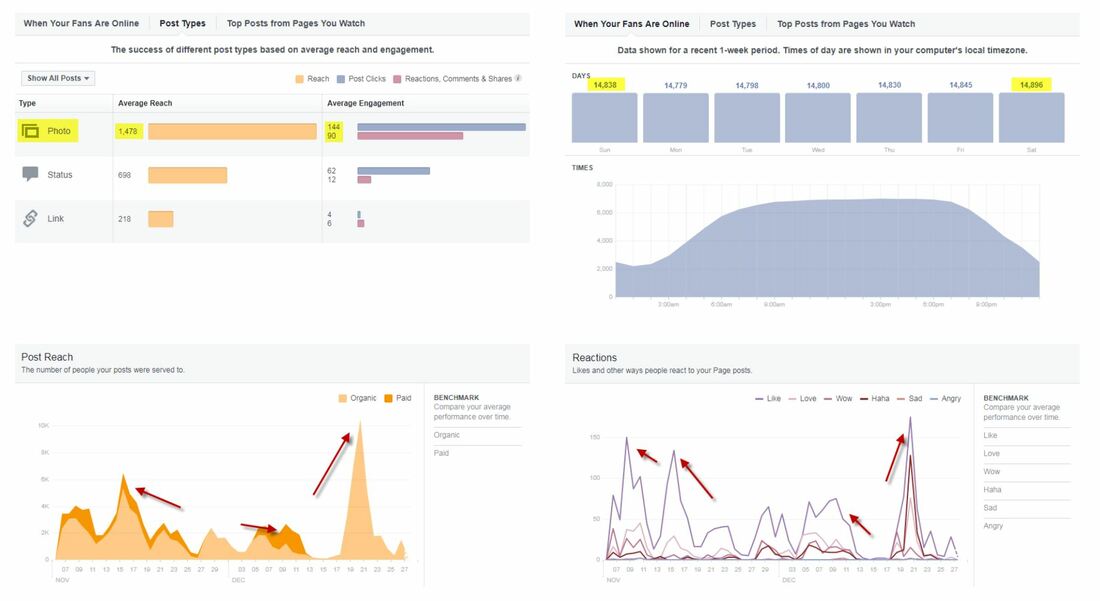
From the insights I can see when my audience is the most active, what post types they are most engaged with, and which of my posts they interacted with the most organically vs. paid.
​
Even with a quick glance, you can see how powerful looking at this information can be. Making content and posting it without any idea of what your audience is responsive to can result in lost time and energy, not to mention money if you're spending money on content creation.

​Discover your Audience using Insights

Knowing your audience is one of the most important things you can know as a leader in your organization. Whether you are looking to nurture your current audience or reach new people to bring them into your organization or get your message in front of them, you need to know them and understand them intimately.

Before I start any campaign, whether social media marketing or not, I always do as much research as I possibly can so I can understand who I am speaking to and what they need to hear.

Using Facebook's Audience Insights tool, you can do just that. Their incredible suite of features allow you to do a deep dive into your audience with powerful information about;
  • Audience demographics
  • Geography
  • Interests
  • Education
  • Household income
  • Employment status
  • Device usage
  • Spending habits
  • Relationships
  • Facebook advertiser/admin info.
  • etc.
There are literally hundreds of different ways that you can research your audience using Audience Insights - you can even see what pages your audience likes more than others, giving you incredible control of how you market to them.
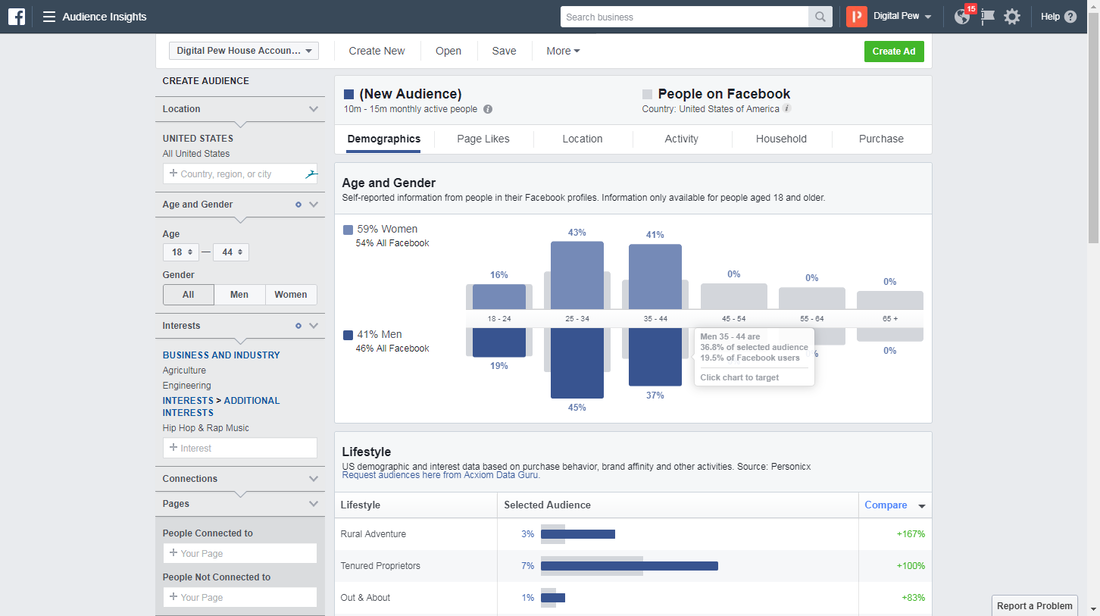
Audience Insights Tool

​'Do' use Ad Manager - 'Don't' Boost

Let me clear this up, using Facebook Boost isn't a bad thing and can actually be a great tool. However, that tool is too often a crutch to Facebook Page Admins looking to pump out a quick advertisement to get results or at least the illusion of results. 

If you want to launch a Facebook Ad Campaign, start with the Ad Manager, not with boosting a single post.

Boosting a post can have a lot of advantages if your content is performing well, but if you want to have a strategic approach to how you spend your advertising dollars, setting up a Campaign, Ad Set and Advertisement within Ad Manager is your best bet.

First, some basics on boosting... 

When you boost you are limited to the audience (unless you are intentional about setting one up) the placements you can use (more about that in the next point) and the content that you can promote. 
​

If you ever boost a post and then look in Ad Manager you will also notice that it is linear once it is setup: Campaign, Ad Set and Ad are all the same thing, a straight shot all the way through.

Click here to learn more about why you shouldn't push the Facebook Boost button. 

​Edit your Placements

With Facebook Ads you can customize where your advertisements will appear to your end-user. 

For example, you can choose to only display your advertisement on your audience's Newsfeed and Sidebar, or even limit it to the 'Audience Network' that Facebook makes available. 
​
You can also exclusively limit your advertisement to Instagram or an Instagram Story even - really there are a ton of different options and customizations available that you can use to get your message in front of your audience.
Facebook Ad Edit Placements
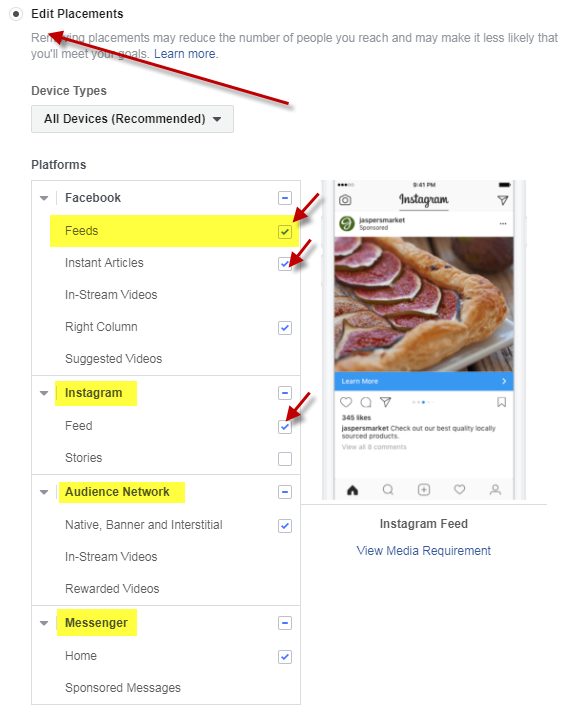
Placements are often one of the most overlooked customizations that Facebook Ads have available, but can significantly impact how your advertisement appears to your audience and interacts with your brand.

Facebook also recently announced that their Audience Network is expanding and customization options exist for users looking to Exclude Audience Network members or specific categories that they don't want their advertisements appearing on.
​
Here is a quick breakdown of the different Placement options:
  • Feeds: These are your most common placements that you are familiar with and still some of the most effective ones. This placement will put your advertisement directly in your audience's newsfeed. While these are some of the most effective placements, they can also be skipped over very easily as users are scrolling their timeline.
  • In-Stream Videos: These are the equivalent of video advertisements. When someone is watching a video on Facebook and an advertisement cues up, that is your advertisement that will be played. If you have ever used YouTube, this works similarly.
  • Right Column: Similar to the 'Feeds' placement, this will put your ads in front of your audience in their newsfeed area in the right sidebar. Unlike the newsfeed area, the right sidebar is sticky and will follow your audience in the case that they scroll down the page. The placement itself is much smaller however and for me (historically) has not performed as well as the newsfeed placement.
  • Suggested Videos: Based on the preferences set up in your Audience section, Facebook will suggest your video content to your audience through the videos that they are already watching. If your audience is engaged with content already and what you are bringing is great quality content that connects with them, they will watch your video based on Facebook's suggestion. I've seen video suggestions perform phenomenally well with the right budget and creative.
  • Instagram Feed: You can place your advertisement directly in your audience's Instagram feed. This is similar to the Facebook Feeds option listed above. Each advertisement has the option for a Call to Action button as well, though it is not required. This is great for getting engagement for younger audiences who are frequent on mobile devices.
  • Instagram Stories: The Stories feature on Instagram is relatively new, showing portrait styled videos and images similar to Snapchat. Facebook allows you to place advertisements directly into Instagram Stories - these have performed incredibly well for me in the past. It's not uncommon for a campaign to have .33 to .60 cents a click with low bounce rates and long session times (based on the website). Instagram and Facebook stories could be huge for engagement, don't miss the section below where I cover that in more detail.
  • Native, Banner and Interstitial: These ads are often used within mobile applications and can be extremely powerful if leveraged correctly. I have never had the pleasure of launching a campaign that was aggressive with these types of advertisements, but in a nutshell - banner ads display a banner with a call to action button, native ads are typically rectangle ads that occupy space within an application screen and interstitial ads are full screen ads that cover the entire applications screen.
  • Audience Network In-Stream Videos: This is the same as Facebook's option except within their Audience Network. If someone isn't watching videos on Facebook's platform directly, you can still advertise to them if they are on an affiliate network, which is great.
  • Rewarded Videos: If you have ever played a game on a phone or mobile device, it's likely that you have seen a Rewarded Video. These are video advertisements that give users in-app purchases or premiums once they finish the advertisement. This is a great way to guarantee that your audience is actually watching your advertisement all the way through, although, that is no indication (truly) of engagement, these ads are great for brand awareness and remarketing/retargeting.
  • Messenger Home: This placement puts your advertisements directly in front of your audience members who use Messenger. Messenger has now (mostly) become it's own standalone application with a unique newsfeed with content tailored for Messenger users. This means that a user on Messenger is not guaranteed to see the same content or the same advertisements as on their Facebook account. Users behave differently on Messenger than other apps as well, which is important to know and consider when developing your campaign.
  • Sponsored Messages: This placement allows you to send advertisements directly to audience members who you have already engaged with on Facebook Messenger with previously. This is a great tool that you can leverage and keep conversations open and

​Promote on Instagram

While I say this with a grain of salt, not knowing every single market and industry, the fact still remains for many campaigns - Promoting on Instagram is a must for your campaign, especially if you're using images and video.
​

I can cite countless examples where I've had the exact same image content on both Instagram and Facebook, and without a doubt Instagram performs much better with a smaller audience than Facebook. Considering that Facebook is becoming increasingly strict with how they show content to their audiences now. 
Promoting on Instagram compared to Facebook
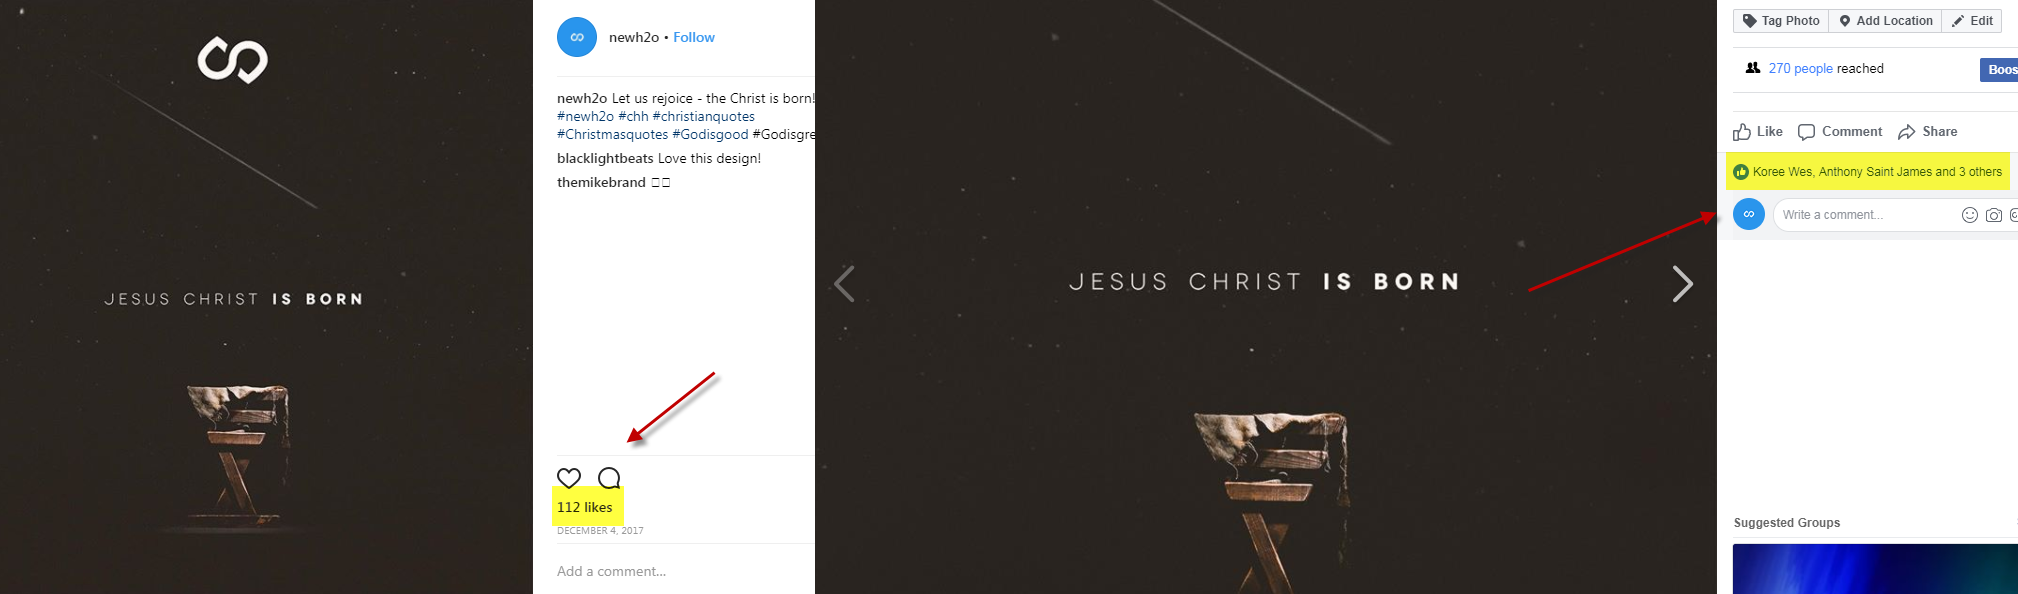
In the example above, we can see an almost 2000% better performance on Instagram when compared to Facebook for the exact same content. It's also worth noting that the Facebook page for this account has 17k+ 'Fans' and on Instagram there are roughly 3k+ followers. 

Instagram has about 17% of followers that the Facebook page has, yet it performs astronomically better.
​
This isn't an uncommon thing - skipping out on Instagram could cost you valuable traffic and engagement if not done correctly. 

​Measure Performance (Daily)

Something that is often forgotten, even with successful campaigns, is to measure your campaign's success (or failure) on a daily basis, gauging how things are performing. 

If you are aware of what is performing well and what isn't, you can improve on the areas that are giving you the most value while changing your strategy or approach on the things that aren't.

Here are some simple questions that you can ask and some basic formulas you can use to see how your posts are performing and how your advertisements are performing (these are subjective based on my experience, so take it with a grain of salt):

Page Posts
  • What types of content are performing the best? (Insights -> Posts -> Post Type)
  • What time of day are my users/audience members most active? (Insights -> Posts)
  • Are we getting or losing 'Likes' (Insights -> People -> Where Your Page Likes Happened)
  • What posts get the most 'Reactions', 'Comments' and 'Shares'?
  • How are the responses to my content? Positive, negative?
    ​
Advertisements
  • What is my Campaign Objective? (There are a number of different objectives that you can choose from)
  • What are my Key Performance Indicators? (Clicks, Cost Per Click, Click Through Rate, Reach, etc.)
  • Which one of my Ad Sets is performing best?
  • Which one of my Advertisements is performing best?
  • What is my average Cost per Click?
  • What is my Click Through Rate?
  • What is my Event Response cost? (For events only)
  • What is my Average View Time? (Videos only)
  • How should I adjust my budget? More money, less money?

​Evaluate and Optimize (Repeat)

This is the shortest and most straight-forward point that I can make - constantly watch what you are doing and find ways to do it better.

Use data to drive your decision making but allow your instincts to have their place in the scheme of strategy - your gut feeling shouldn't be entirely discounted and the data will rarely give you 100% of a reason to do something.
​
In summation...
Picture
Reposted with permission from DigitalPew.

More Resources on Facebook Advertising:
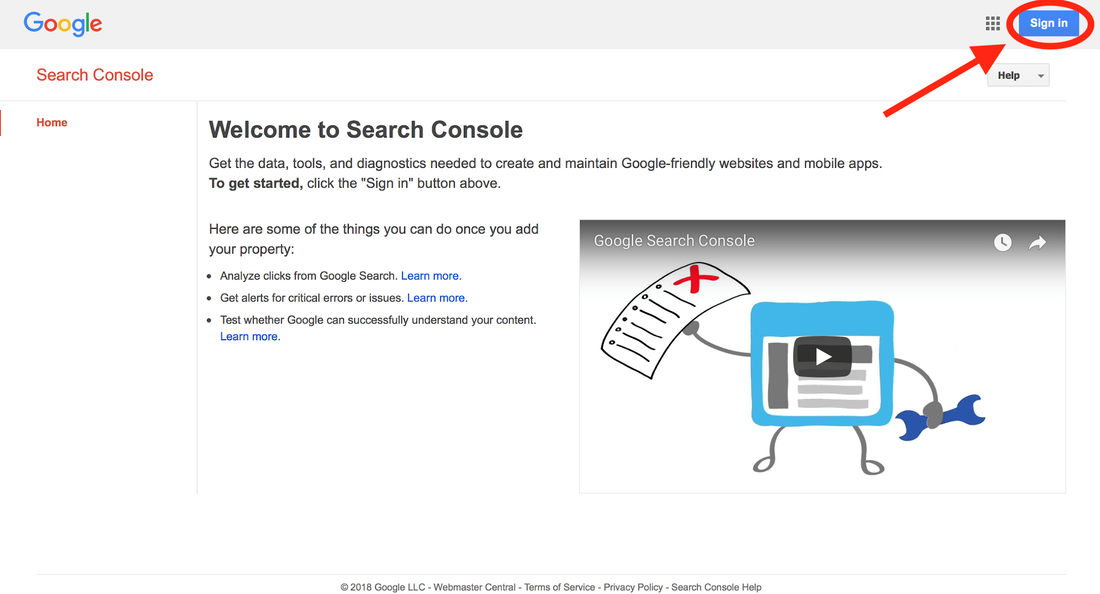
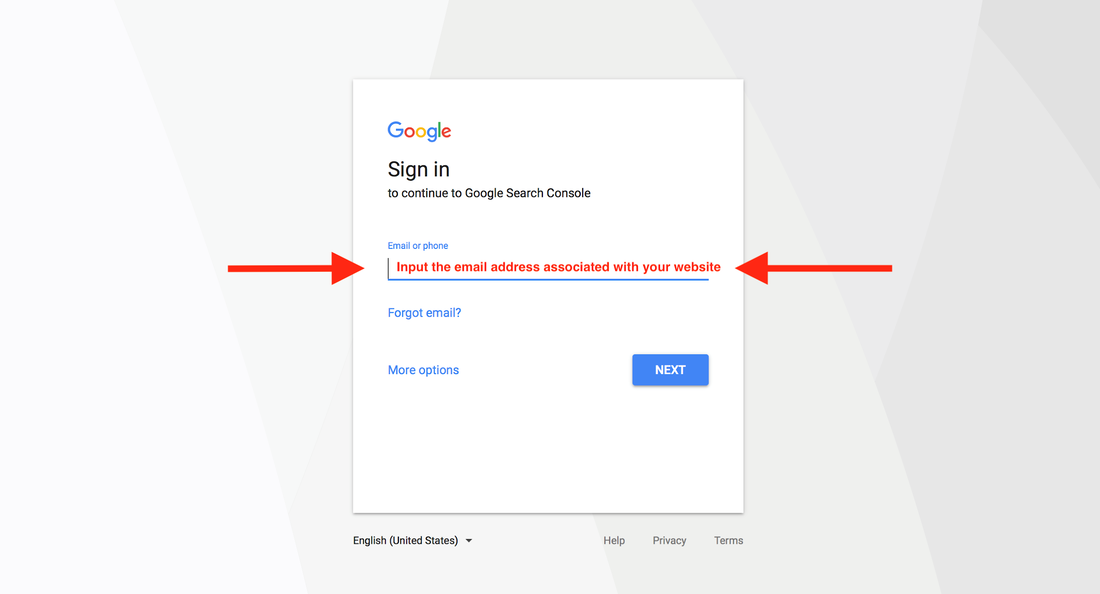
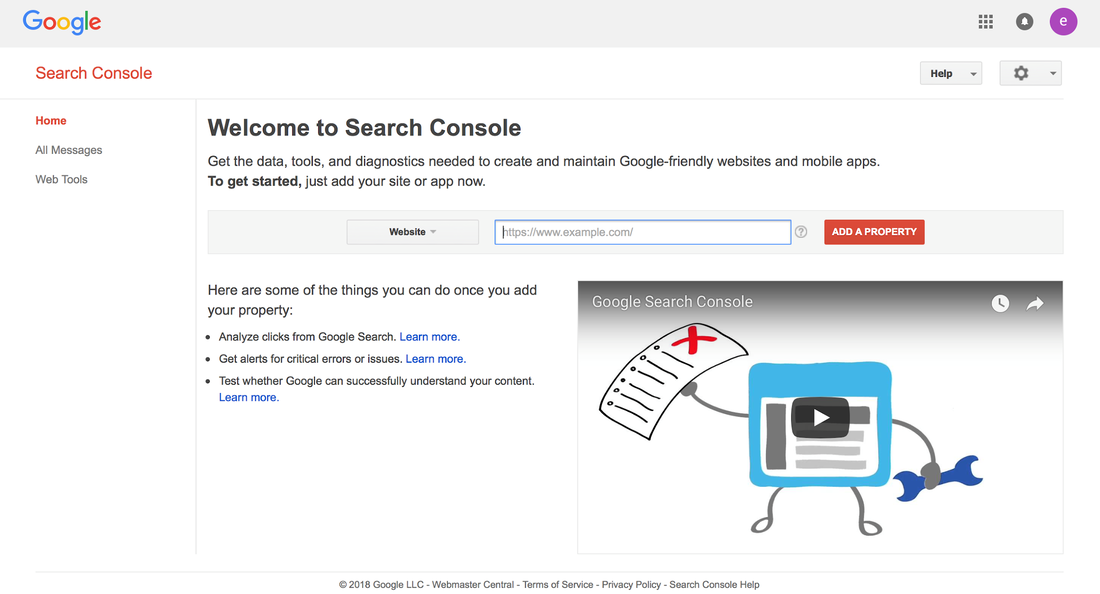
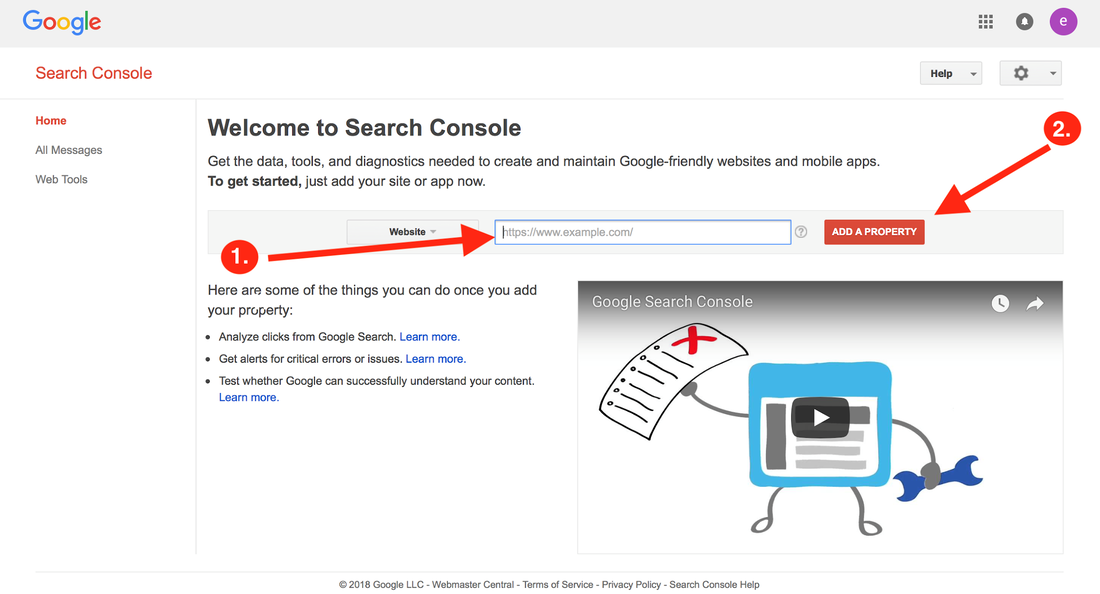
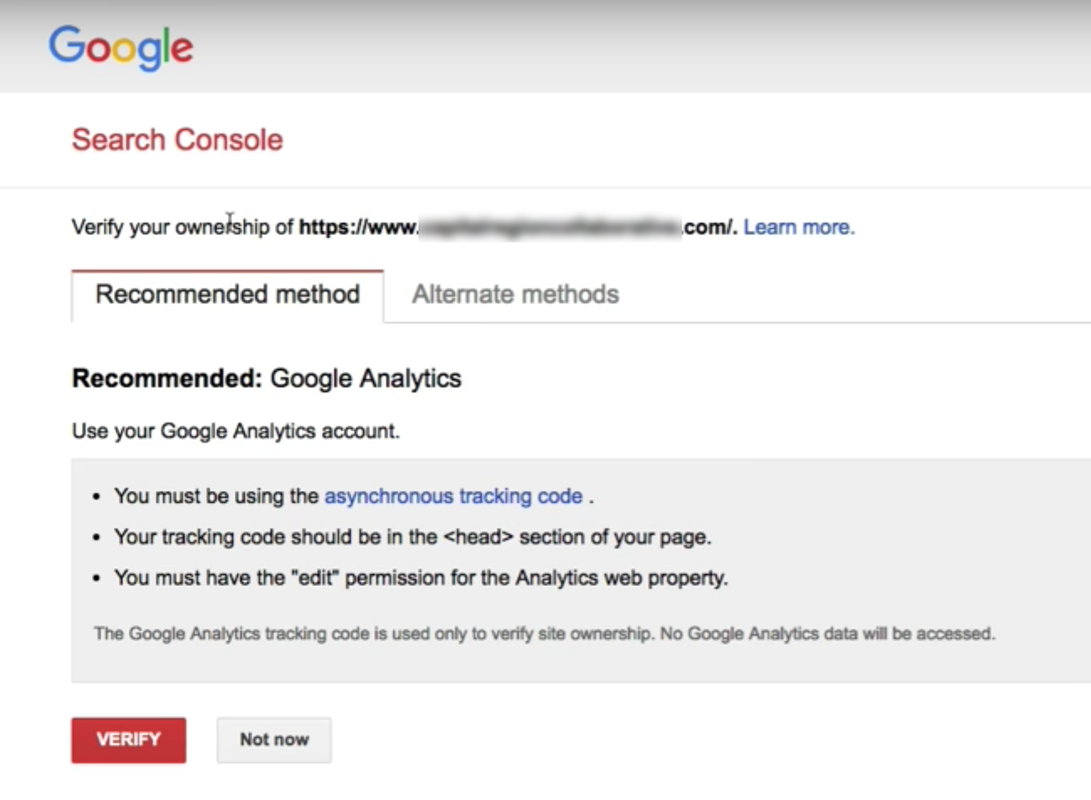
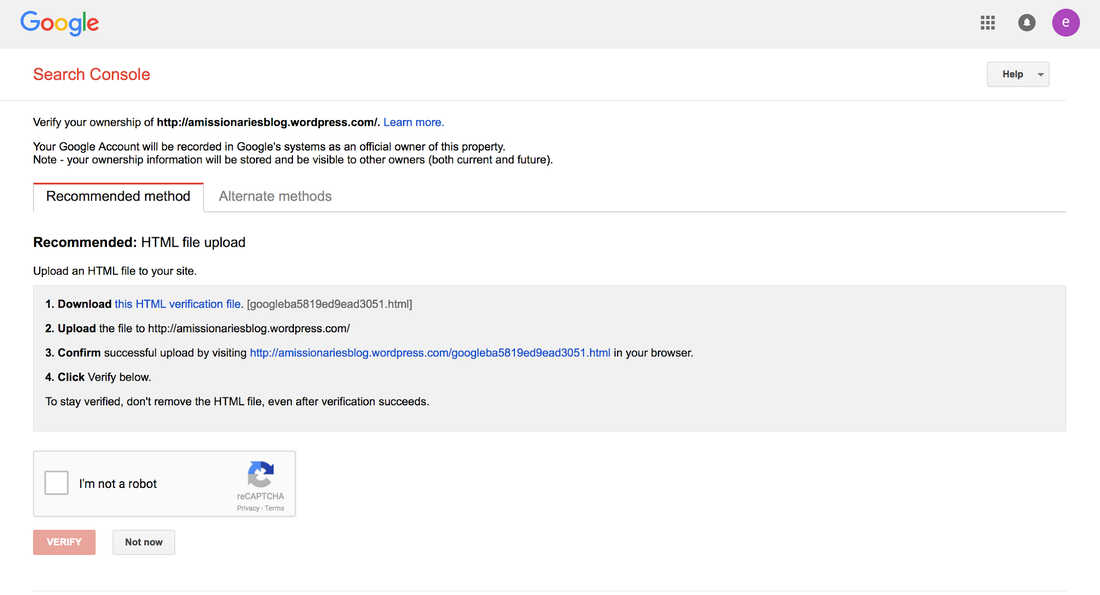
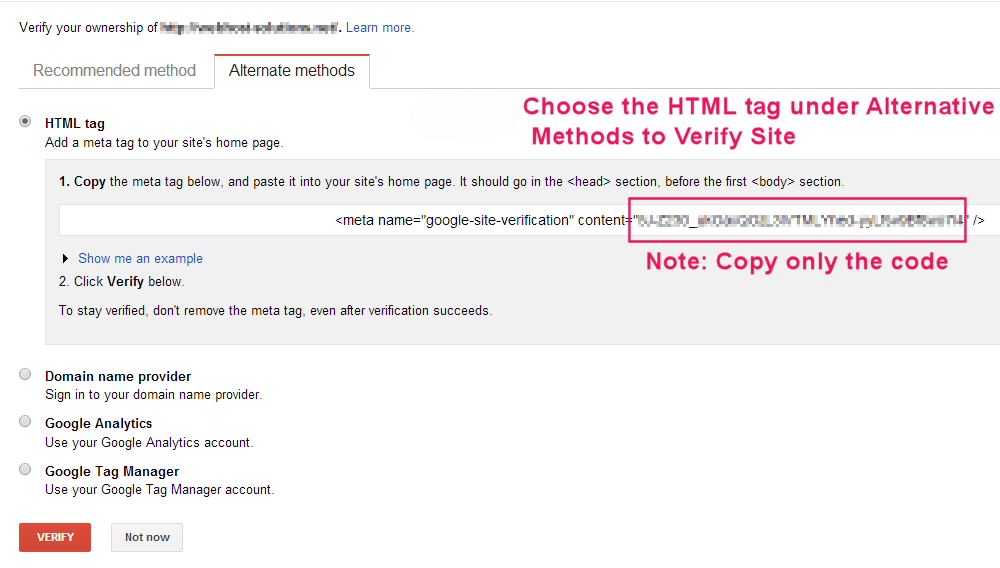
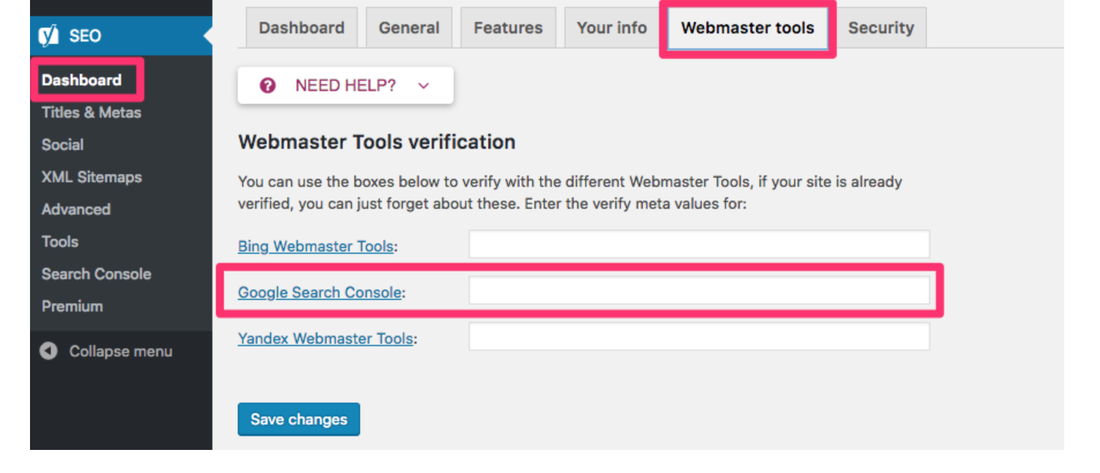
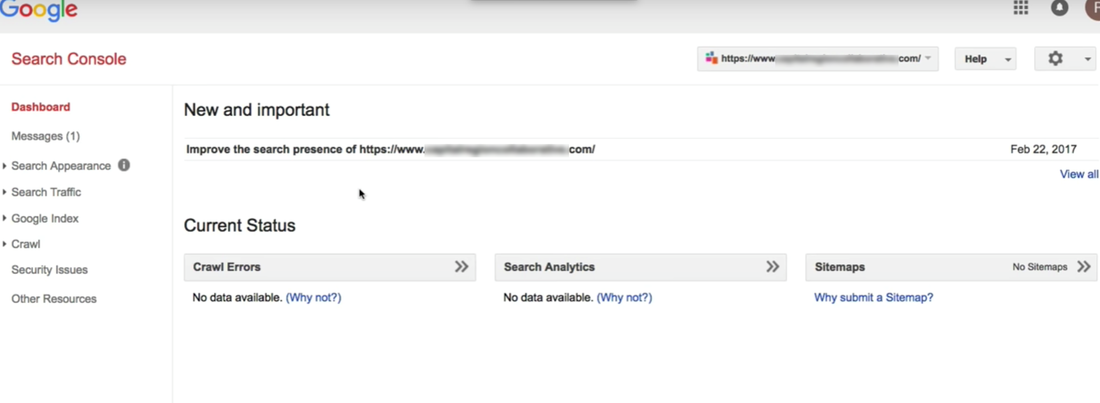
  • 5 Strategies to Overcome "Facebook Zero"​
  • An Introduction to Facebook Pixels
  • Crash Course in Tracking, Analytics & Advertising (download)
  • Don’t Push the Boost Button on Facebook–It’s a Trap!​​
  • Facebook Business Manager Set Up Guide ​
  • Facebook Targeting Infograph (download)
  • Key Terms to Understand When Placing Facebook Ads​​

17 Comments

Beginner Tutorial for Google Search Console

1/28/2019

1 Comment


Amy Prindle

The Center for Online Evangelism is a missionary project devoted to developing online mission stations.

​Edits and additions by Jamie Jean Domm


How is your site interacting with Google searches?

​Search Console is incredibly useful in a variety of ways. It’s like a peek under the hood to make sure everything is running properly. Not only will it show how Google is interacting with your site when it comes to searches, it can also notify you if the site has been hacked or if there are navigational errors. 

Google Search Console Important Terms and Functions

Anchor text: Anchor text is the visible, clickable text in a hyperlink. In modern browsers, it is often blue and underlined, such as this link to the moz homepage.

Crawl: The process of Googlebot discovering new and updated pages to add to the Google Index.

Google Index: In order for your site's contents to be included in the Google’s search results, it must be Google Indexed (think of a library!). Google Index lists all of the web pages it knows about. When Google visits your site, it detects new and updated pages and updates the Google Index.

Internal links: Links on one page on your website that links to another page on your website to provide reference information, guide the user through the intended content journey, or to lead them to action. Being strategic with internal linking provides different types of users with the proper pathways for finding what they want.

XML SiteMap: A file where you can list the web pages of your site in its hierarchical order to tell Google and other search engines about the organization of your site content. XML stands for “extensible markup language” schema, which is more precise than HTML (hyper-text markup language).

Search Console Home—Your Properties. (Are You Verified?)

After logging into your Google account and navigating to console home, you’ll see the Properties (websites) you selected to manage. If any of them say “Not verified” at the top left of the thumbnail, you’ll need to refer back to search console section for verification methods. Most of the Search Console functions will not be usable until the Property ownership is verified.

Once you click on the property/website, you’ll be directed to the Dashboard.

You’ll see three sections under Current Status in the lower half of your screen: Crawl Errors, Search Analytics, and Sitemaps.

Here you’ll be alerted if there are any immediate issues that need your attention in these areas. However, for the purpose of this lesson, we’ll take you through the top priority functions in the left side menu of Search Console as you start to get used to this tool.
Picture
Crawl (left menu)

If you have any crawl errors, you can click on Crawl > Crawl Errors in the left side menu to learn more about what’s causing these errors.

You’ll first want to see if your server is causing any crawl errors. If these errors persist, you may need to contact your hosting provider.

Being behind a firewall can also affect Googlebot’s ability to crawl your site. You may need to adjust your firewall settings.

Another common crawl error has to do with a robots.txt file, which tells Google which pages it can crawl and which pages you do not want it to crawl. In many cases, though, you want Google to crawl your entire site, and you don’t need a robots.txt file.

If you have any broken links, they will be listed under “URL Errors” below the line graph.
Picture
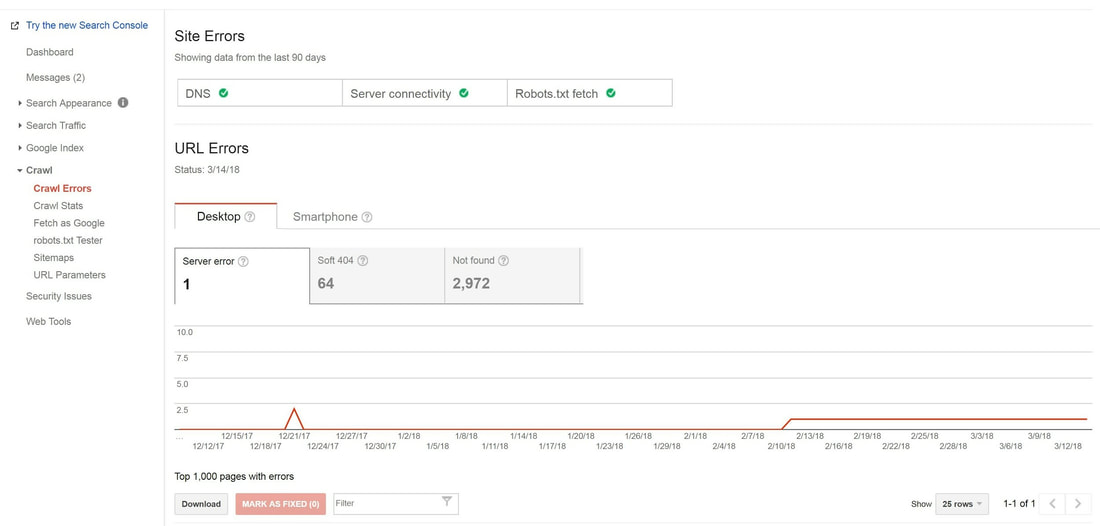
Crawl--Sitemaps

To help Google properly crawl your site with its Googlebot, you’ll want to submit a sitemap.xml.

If your website is on the AdventistChurchConnect platform, a sitemap has been created automatically. If you’re using WordPress, you’ll need a plugin to generate a sitemap.xml file.

(For additional guidance: What is a Wordpress Sitemap or How to Create a Wordpress Sitemap.)

At the top right you’ll see the red “Add/Test Sitemap” button. Clicking the button which will bring up a dialogue box with your website URL with a forward slash. Type in “sitemap” (ACC) or “sitemap.xml” (WordPress and some other CMSs), then submit.

(If your website is on another development platform, such as Wix, Squarespace, 1&1, etc., check with your technical documentation or ask support for information on sitemaps.)
 
Search Traffic (left menu)—Search Analytics
NOTE: If you just set up your Search Console account, Google may not have yet had a chance to crawl your site again and send back data. You may need to wait a few days.

This may be the most important tab for your website in Search Console, at least for now. You can gather a snapshot of how your website is doing in the midst of your SEO efforts.

Before selecting an option, make sure to check the boxes of Clicks, Impressions, CTR (click-through-rate) and Position. You’ll want to see all this information when you click on the various reports. 
Picture
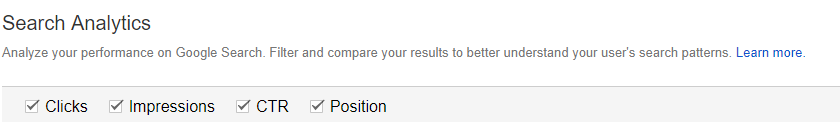
​Right now we’ll look at the report that will be most immediately useful to you--Queries.
Picture
Queries
​

This lists search keywords and phrases that pull up your site in the search results. Ideally, these terms would match what you intend to rank for.

If you notice a discrepancy between how you wanted people to find you and how they actually ended up finding you, you might want to adjust your content to include different keywords, or better optimize your content for the keywords you want to rank for.

All in all, this gives you an insight into your audience’s preferences and goals, as compared to what your site offers. You’ll want to ask questions like:
  • Are people searching for the keywords commonly used in the site, or are they using other search terms that we may not have thought of yet?
    • How can you optimize your content for these different, or additional, keywords?
  • Are people finding your site through a non-relevant keyword, then leaving your site because it’s not what they expected? This can raise your bounce rate.
    • Why might you be ranking for this keyword that is not exactly matching your content?
 
Search Traffic (left menu)—Links to Your Site
​

This section shows you which outside websites have active links to your site (backlinks). If you just set up your Search Console account, there may not be any data here yet. If you have had Search Console set up for at least a few days and there still isn’t any data in this section, it could mean that you have no backlinks at this time.

Having other sites link to your site in a legitimate, true-referral manner (i.e., someone referencing your site in a blog post, social media post, etc.) can act as a significant SEO boost. It tells Google (and people) that other entities online recognize you as a credible authority for the given topic.

Examining your backlinks gives you another look at which content is most popular, by looking at the “Your most linked content” section. This is especially positive, meaning that, not only did this page get a lot of traffic, it was liked well enough to receive a link to it from an outside source. This is a better representation of content quality than page traffic alone.
Picture
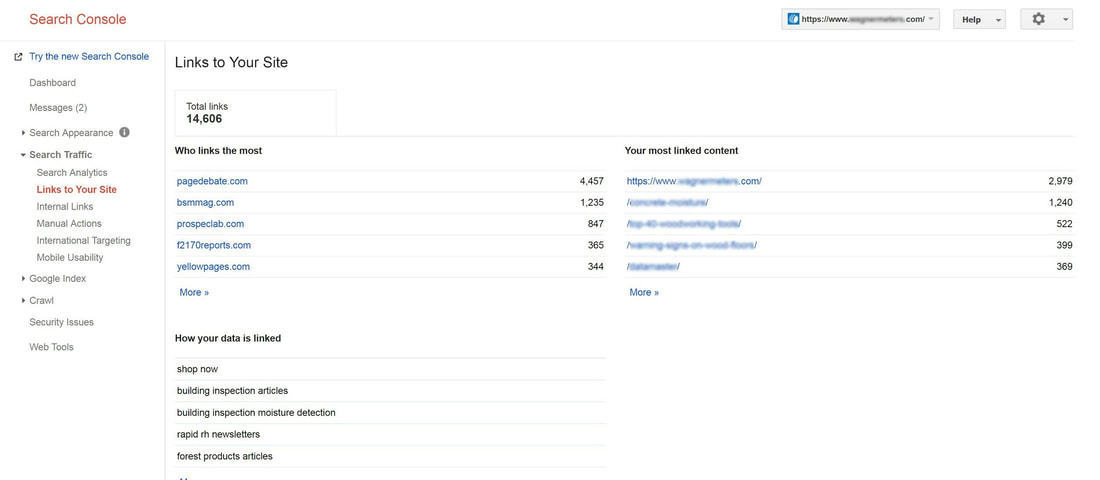
Search Appearance (left menu)—HTML Improvements

Here you’ll look for any HTML errors, such as missing or duplicate title tags, or titles that are too long to be shown in their entirety. If any pages have duplicate or missing meta descriptions, you’ll want to craft a 162-character page description to encourage searchers to click through to your site!

Having duplicate or missing tags can affect how well Googlebot crawls your site. These can be simple fixes, especially if you run a WordPress plugin such as Yoast.

You’ll want to go to all the pages with either duplicate or missing content and replace with new titles and meta descriptions (learn more about meta descriptions in Section VI).
 
Google Index (left menu)—Index Status

Especially if you’ve just set up Search Console, you may have to wait for “Googlebot” to index your website. Once it’s indexed, you’ll be able to view Google’s last index in a line graph.
​
The blue line shows you how many pages were indexed, and the orange line (click on Advanced to view) shows how many pages were blocked (i.e., these pages will not show up in search results). 

Moving Forward

These introductory steps can keep you plenty busy. Especially if your website is large with several functions, you may find several areas to improve or optimize right away. If your website is still new and growing, this can give you direction for the site’s future development.

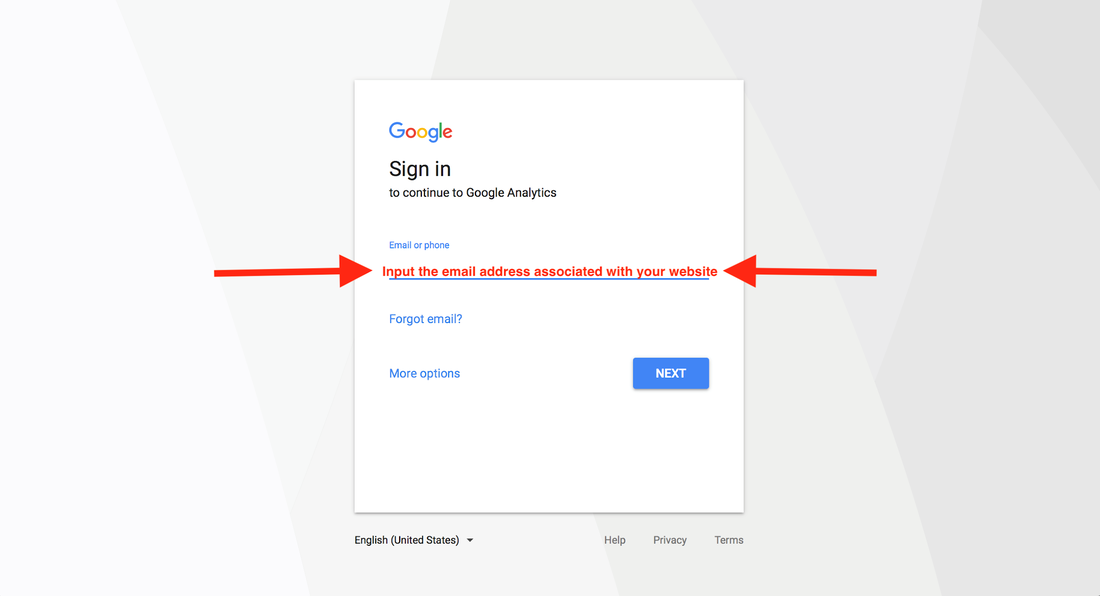
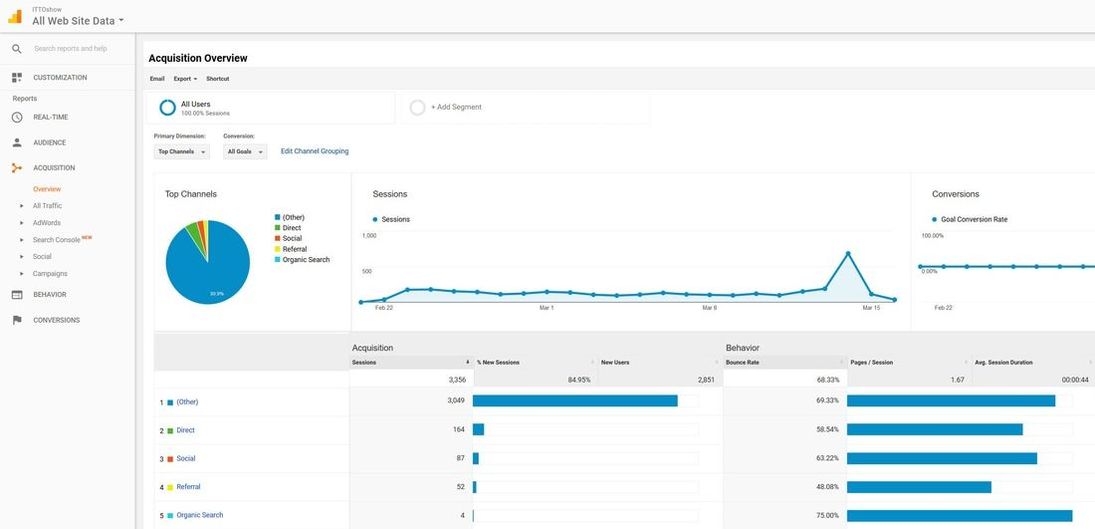
If you’d like to continue ahead into more advanced features of these tools, here are some recommended resources:

  • A Complete Guide to the Google Search Console
  • An Insider’s Guide to Using Google’s Search Console to Fix Your Site
  • Google Support’s introduction to Search Console
1 Comment

Beginner Tutorial for Google Analytics

1/28/2019

0 Comments


Amy Prindle

The Center for Online Evangelism is a missionary project devoted to developing online mission stations.

​Edits and additions by Jamie Jean Domm


Helping you get the most out of viewing and interpreting this valuable data to most effectively optimize your website.

When you log in to Google Analytics or Search Console with no prior knowledge of these tools, it can seem overwhelming!

But soon you’ll discover just how much you can learn from this data, and how useful it can be in planning technical or content updates. It will become second nature with continued use.

In this section, you’ll learn how to quickly check for site errors that may affect search engine performance or user experience, and you’ll learn to interpret how effectively users are navigating your site. You’ll find out if any important pages are being missed, or if certain pages are causing a drop-off in traffic.

By tracking your audience’s patterns, you can better plan your content to match their preferences and behavior, which can dramatically improve engagement.
​

We’ll start with terms and basic functions, followed by a screenshot-assisted walk-through of each tool.
You will see these terms in the menus and reports of Google Analytics or in Search Console displays, so you’ll likely understand them even better when you see them in context. A technical vocabulary list can seem intimidating at first, but as you get to know and interact with the platform it will quickly start to make sense. (NOTE: Not all terms will be covered in these tutorials—only the most immediately necessary).

Google Analytics Terms and Functions

Terms change so if you run across a term in Google Analytics that you are unfamiliar with,
hover over it and a brief description pops up.
 
Average Session Duration: The average amount of time a visitor stayed on your website. Two to three minutes is favorable, while less than one minute implies that visitors didn’t find what they were looking for.

Behavior: This element measures how users interact with your site, or with applications on the website. Standard metrics include the number of users interacting with your application, the number of sessions those users create, and the screens or web pages they visit.

Bounce Rate: The percentage of users that come to the website and then click out immediately, signifying that they did not find what they were looking for. The lower the number, the better. When the number is higher, this tells Google the page isn’t relevant to the search terms being used to find it.  NOTE: Don’t take this number too seriously—Google often considers it a “bounce” whenever someone hits the “back” button, which doesn’t always mean that the person didn’t find what they needed in the page content! It may be that they found what they needed on that one page and left.

Conversion: Completion of an activity that is important to the success of your business, such as a completed sign up for your email newsletter (a Goal conversion) or a purchase (a Transaction, sometimes called an Ecommerce conversion).

Direct Visitors: Direct visitors have come to your site by typing in your organization’s exact URL into the address bar in the their browser.

Key Performance Indicators (KPIs): Measurable values that demonstrate how effectively your website is achieving its objectives, such as number of sessions, target bounce rate, number of returning visitors, demographics engagement, etc.

New User: A first-time visitor to the website (unique IP address)
 
Page/Session: This shows how much a visitor engaged on the website, such as how many pages they clicked on.

Referral Visitors: Visitors who visit the website because it was mentioned somewhere on another website or blog that they were visiting.

Sessions: A “set” of a user’s interactions within your website that take place within a given time frame (set to a default of 30 minutes). This can mean multiple page views, social commenting, or ecommerce transactions (for more information, try this Google support article).
 
Users: People who have started at least one session during the date range.

Navigating Your Google Analytics Dashboard

NOTE: If you just set up Google Analytics, we recommend letting it gather a month’s worth of data before making in-depth analyses. Otherwise you will not have enough data to truly determine usage patterns. Usage patterns fluctuate throughout the year and around holidays. Over time, you’ll become familiar with the regular patterns of visitors.
 
After logging in, you’ll immediately be taken to your Home area which provides a snapshot of (by default) the last seven days of activity on your website.

By selecting “28 days” in the drop-down menu on the bottom left of that box, you’ll get a more complete picture of average use patterns.

Other boxes on the Home screen show user trends, regions users are browsing from, and which devices are used for browsing (desktop, mobile, tablet).
​
It can also be helpful to scroll to the last box that displays which pages your users visit, with the most popular on top. 
Picture

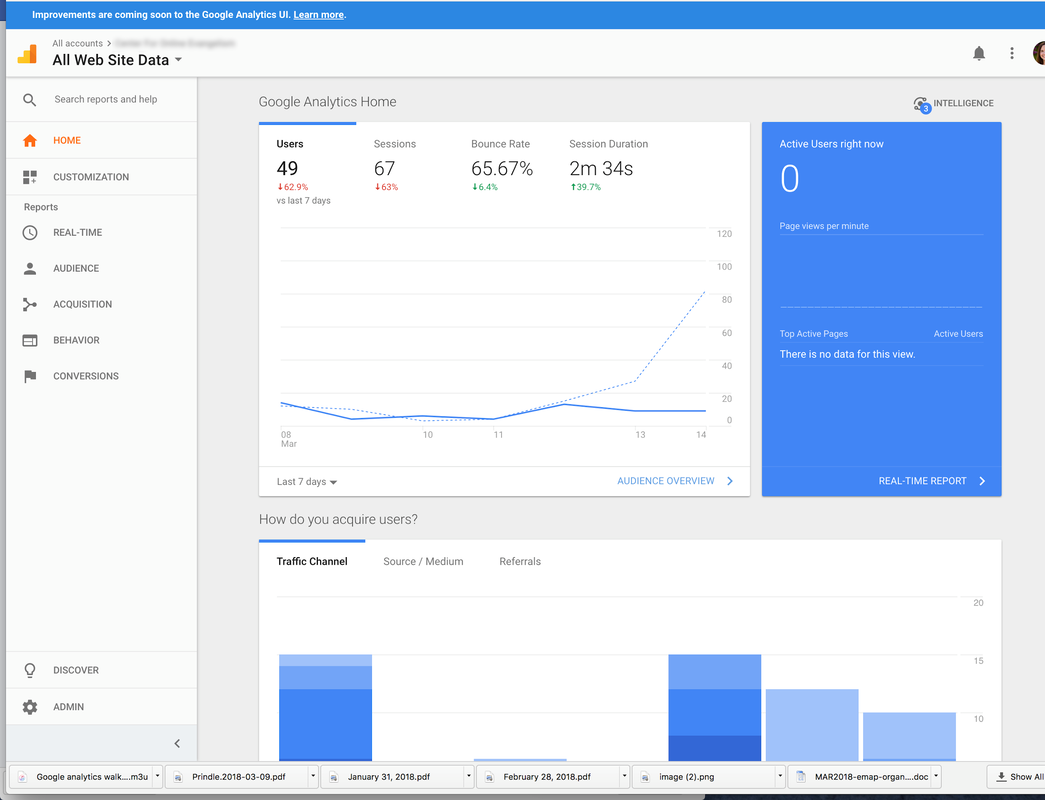
Got specific questions already?

A great place to start your Google Analytics journey is at the top left of the page, the Intelligence section.
 
This will guide you through Google Analytics by asking questions like “Where is my traffic coming from?” or “What were my most popular pages from July 1-24?” 
 
This will also notify you of any inconsistencies in your data. These anomalies (the term Google uses) will be presented as insights.
 
Insights will explain opportunities, trends, or changes that can have an impact on your website. For example, it can show you that a certain landing page is getting more traffic than before or if the number of new users is dropping. The information presented here allows you to adjust accordingly. 
Picture
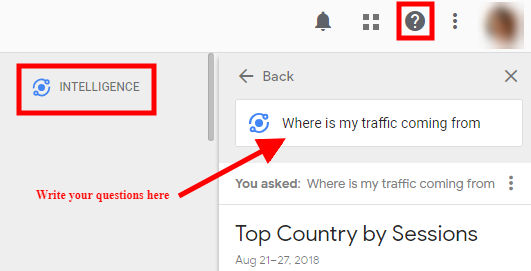
​You can find your insights on your Home page in the second row on the right. 
Picture

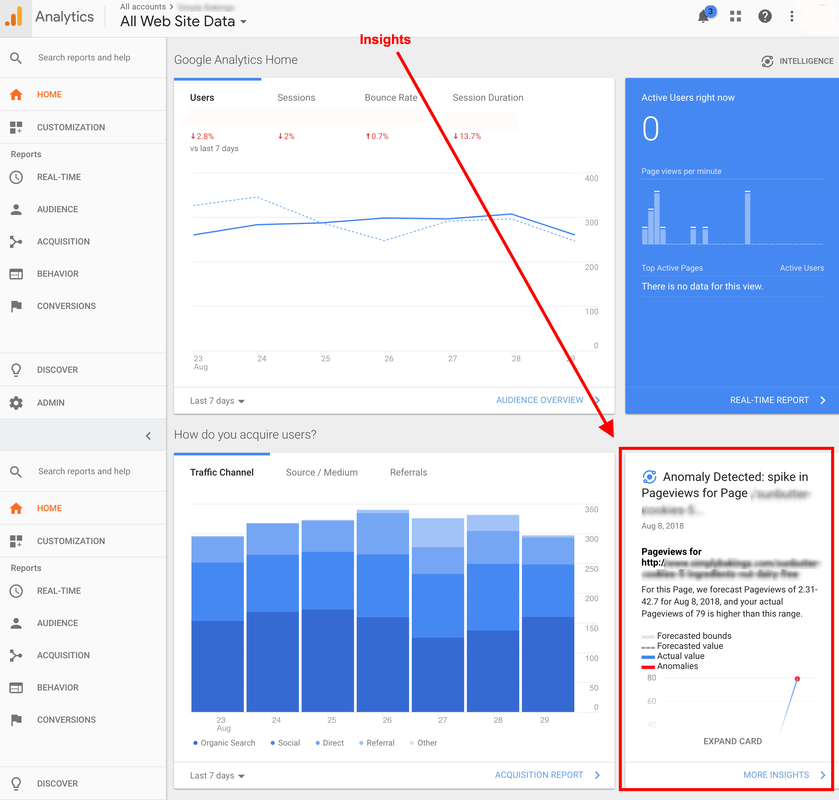
Helpful Reports

With several reports to choose from, the most immediately helpful reports can be:

AUDIENCE—Overview (Who’s visiting?)
​

Above the line graph to the right, select “Month” to get a clearer average. This will give you a more in-depth look at how many users are coming to your site and how they spend their time. 
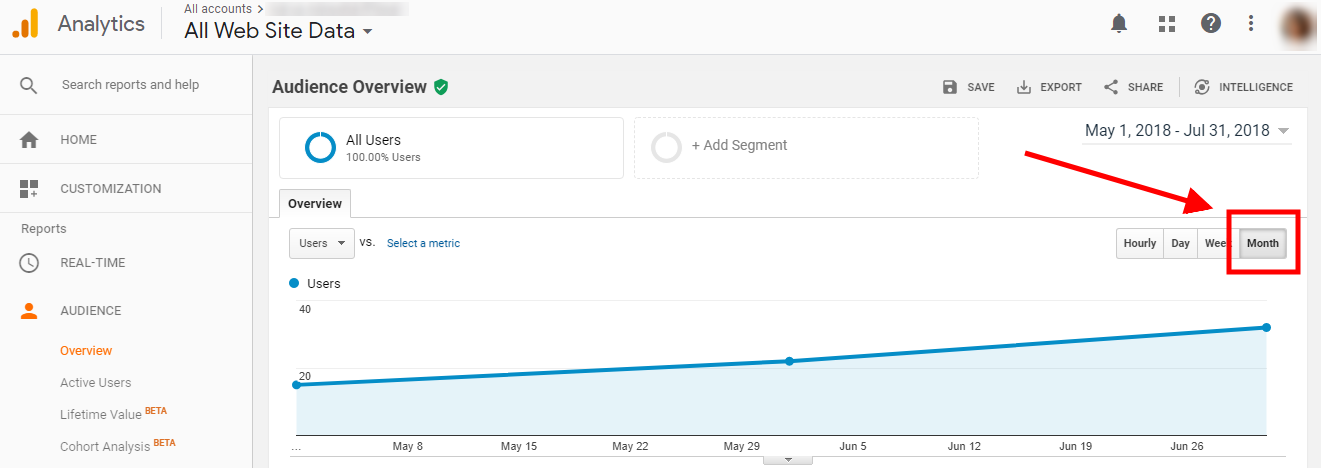
Picture
AUDIENCE—Geo
​

Under Geo you can view the Language used by the viewer. If you see significant percentages in different languages, it could be a tip that a translated page could be helpful to your audience. 
Picture
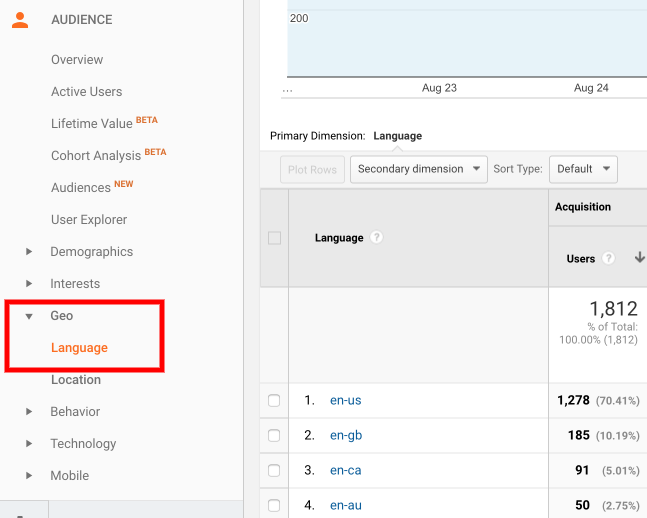
​If you are a local organization that depends upon local traffic to your website, click Geo > Location > City to see if your target area is engaging with your site.
Picture
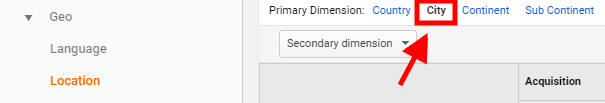
AUDIENCE—Demographics—Overview

If your content is targeted to a certain age or gender, you’ll want to look here. You can view the age and gender (see arrow 2) of the users who visited in the last selected timeframe. At the top right you can customize the timeframe by date (arrow 3).
Picture
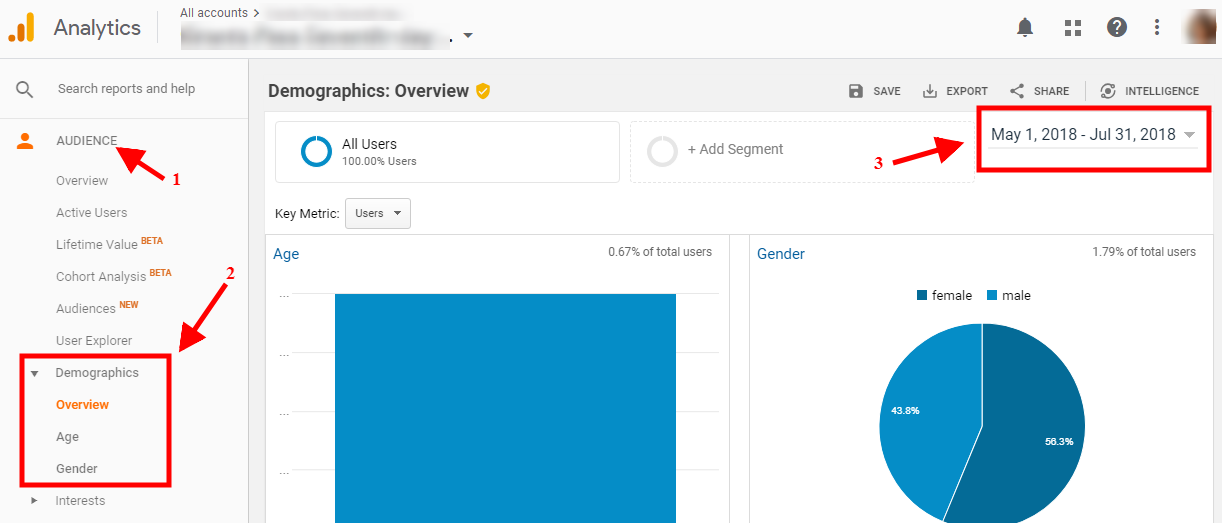
ACQUISITION—Overview (How are they getting here?)
​

With the default timeframe set to 3 months (found in the right corner of the page), view how people are getting to your site:
Picture
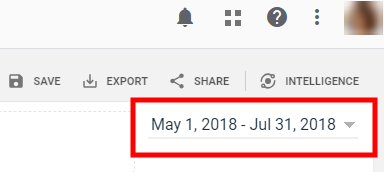
These visitors may have clicked to your site via:
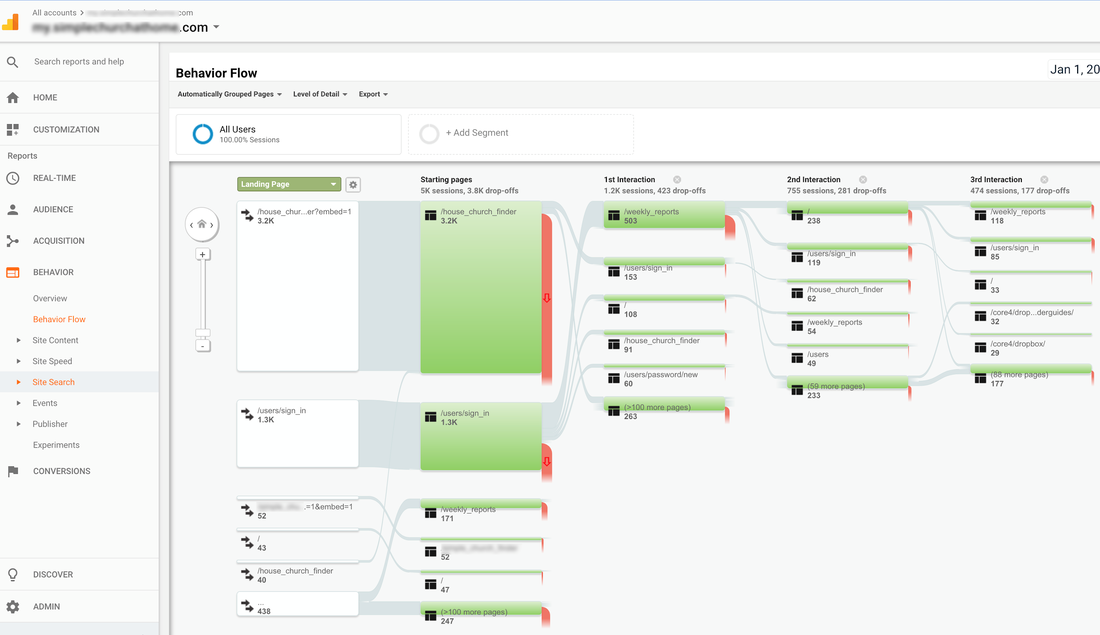
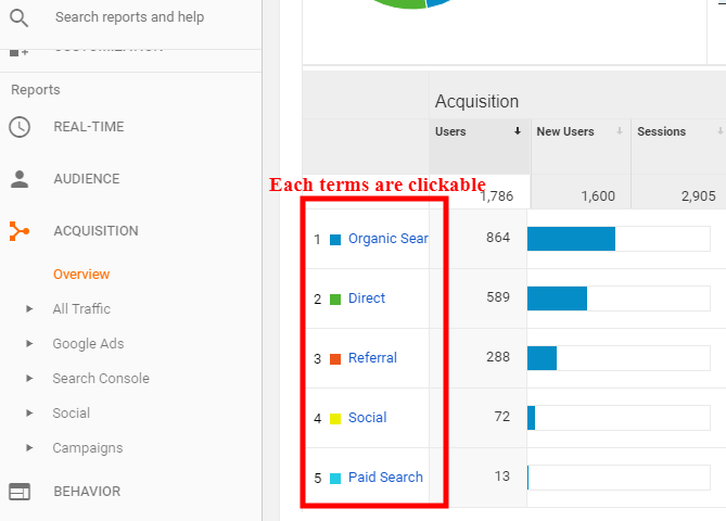
  1. Organic Search (they searched for a keyword or phrase, found your site in the listing and decided to click on it)
  2. Direct (they typed your URL into their browser)
  3. Referral (they clicked on a link on another site)
    1. To find out which sites are linked to yours, you’ll need to use Search Console
  4. Social (they clicked on a link from social media)
  5. Paid Search (they clicked on a pay-per-click ad)
Picture
ACQUISITION—Social—Overview
​

Scroll down in the Overview window to Social Value. Unless you’ve worked ahead, you won’t have any goals here. However, you will be able to see how many sessions have come from which social media platform. Study this data and compare it to how many posts you’ve published in the selected timeframe (3-month default).
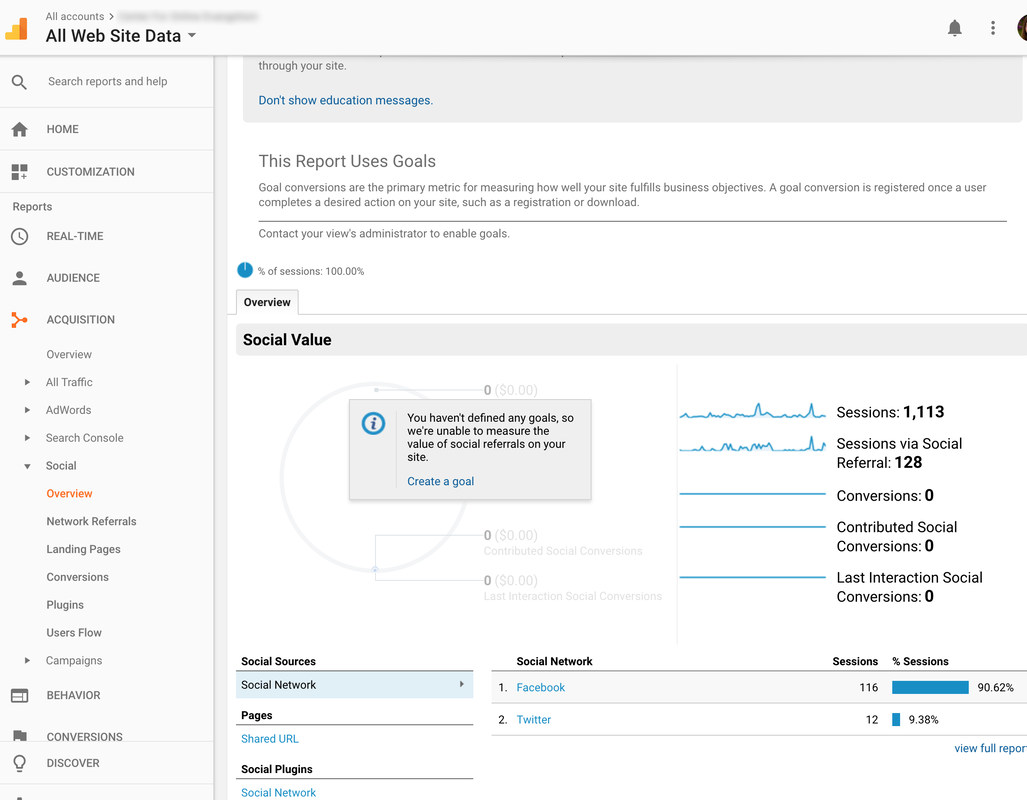
Picture
ACQUISITION—Social—Network Referrals
​

This is big for social media managers! This report lets you see which pages users are coming in on through social media referrals. This can help you track which posts are driving users to your site, depending on which URL was linked in the post. 
Picture
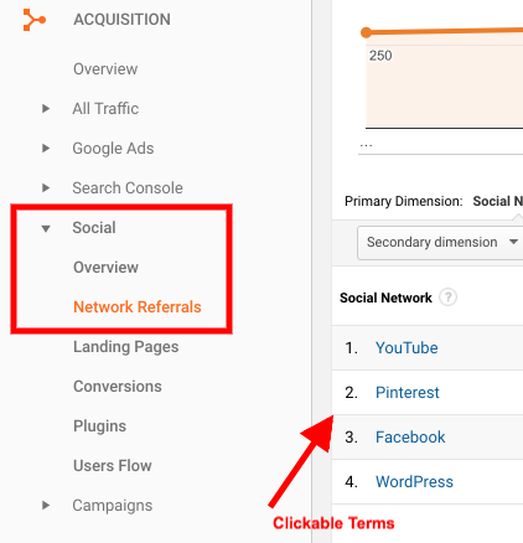
ACQUISITION—Social—Users Flow

This journey map starts with the social media platform that brought the user to your website. See which page URL they clicked on, which can indicate which posts are getting the most activity and which events are encouraging click-throughs.
​
If you hover over the Starting Pages or Interactions, you’ll see a pie chart representation of how many users kept navigating your site, and how many dropped off at this point. Use this data to review your site content, and determine if users are finding what they need or getting frustrated/bored and leaving. 
Picture
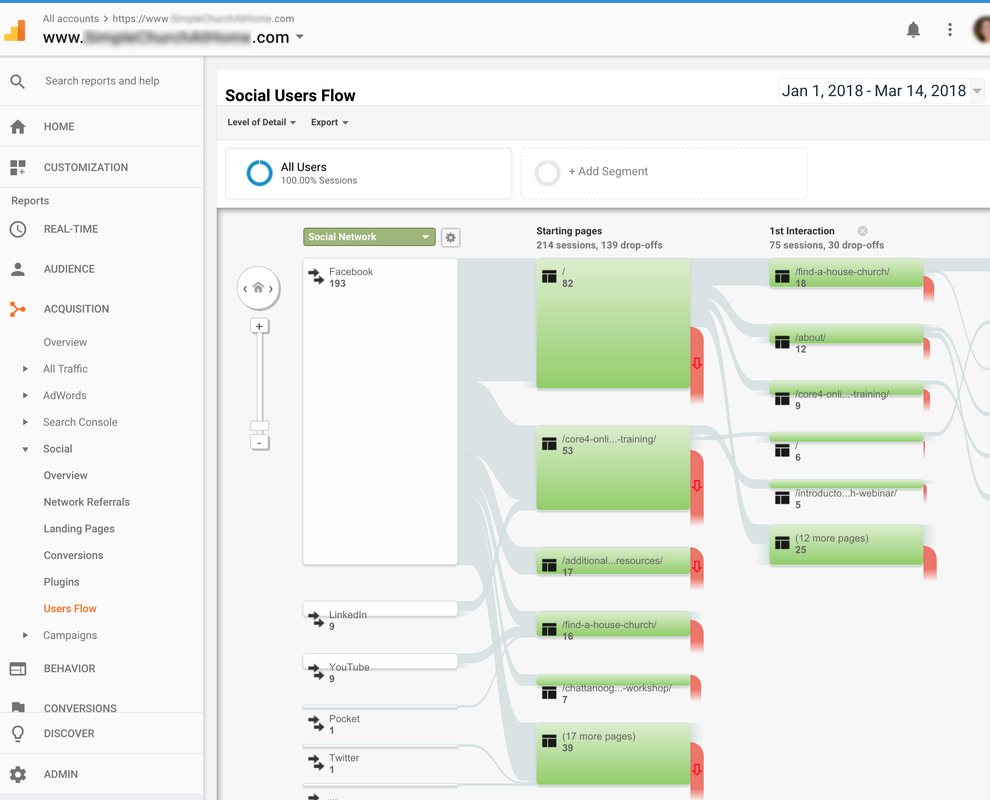
BEHAVIOR—Overview (What are they doing?)

The Behavior Overview provides a graph showing the amount of traffic your website receives and how they use your site. Make sure to select “Month” above the line graph. 
​
These are the most important metrics here: 1) Pageviews, 2) Unique Pageviews, and 3) Average Time on Page. 
Picture
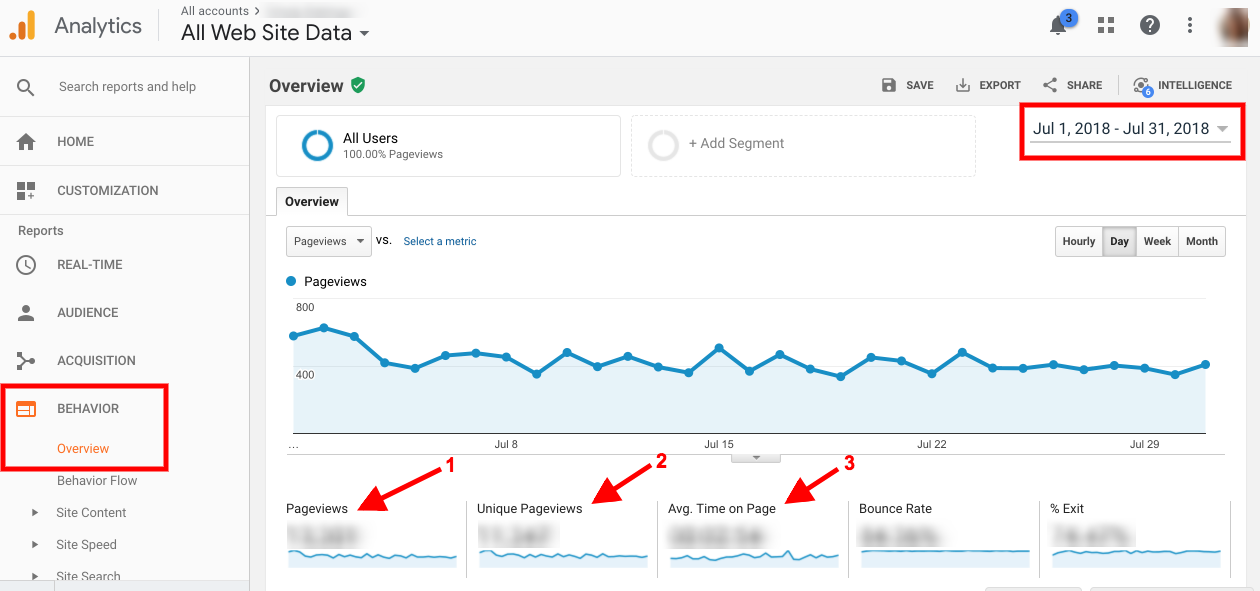
​The Site Content section describes how visitors engage with pages on your website. For example, under ALL PAGES you can see your top pages and how many views they receive, average time on page, plus which type of page is most popular—helping you determine what content performs best on your website (remember the best way to determine this is to select it by month on the upper right on the screen).
Picture
Picture
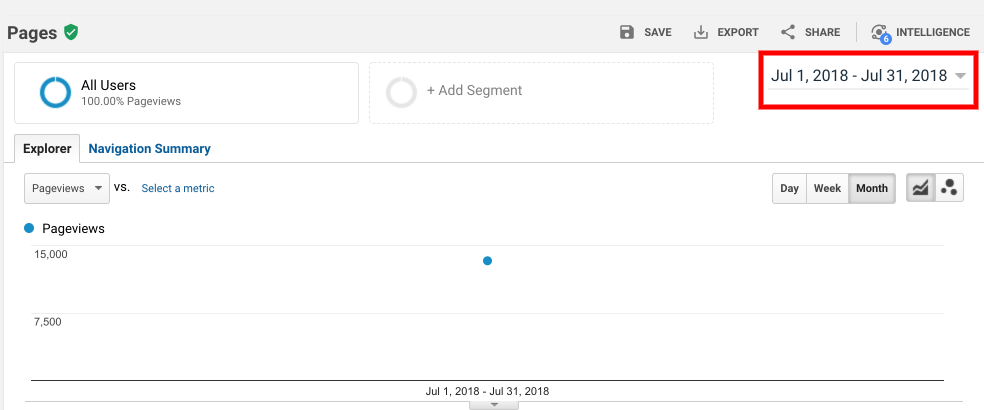
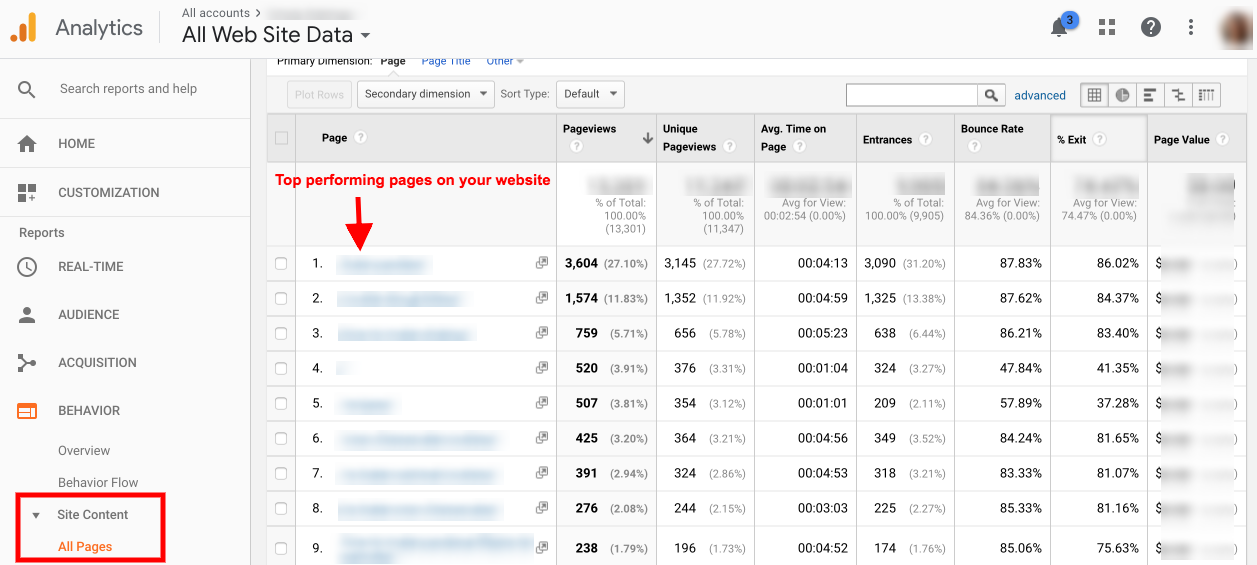
​If you find that your most popular pages are different from the ones you’d like more people to view or spend time on, you might need to adjust your content or how your sitemap is organized. 
Picture
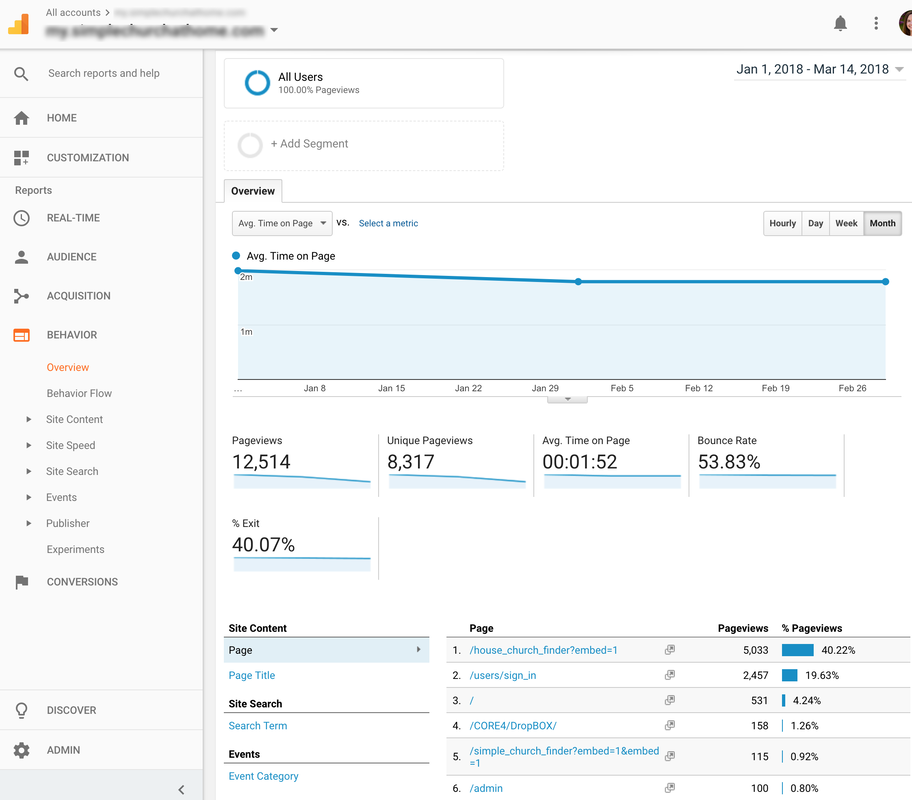
BEHAVIOR—Behavior Flow (Where are they going?)

Another visual journey map shows you which pages users encounter first when they visit your website (listed as the Landing Page). It may be the Home page or it may be an article, contact page, or a bookmarked link that has a map or login function.

You can drag the map to the side, viewing the first, second, and third interactions, to see where users clicked to after coming to the site.
​
You can use visual data like this to see if users are taking the path you intend for them. If not, or if they’re dropping off before they get to a page where you want them to take an action, such as read an article, download a PDF, or make a purchase, it may mean:
  • Your content needs clearer calls to action.
  • Your content needs more persuasive language to encourage them to keep reading.
  • Users are finding the info they want before reaching the page.
  • Users are deciding not to buy/read/download.
Picture
​BEHAVIOR—Site Speed—Overview
​

Select “Month” at the top right over the graph. Remember, you’re shooting for a page load time of under two seconds.

Your average page load time averages data from all your pages.
Picture
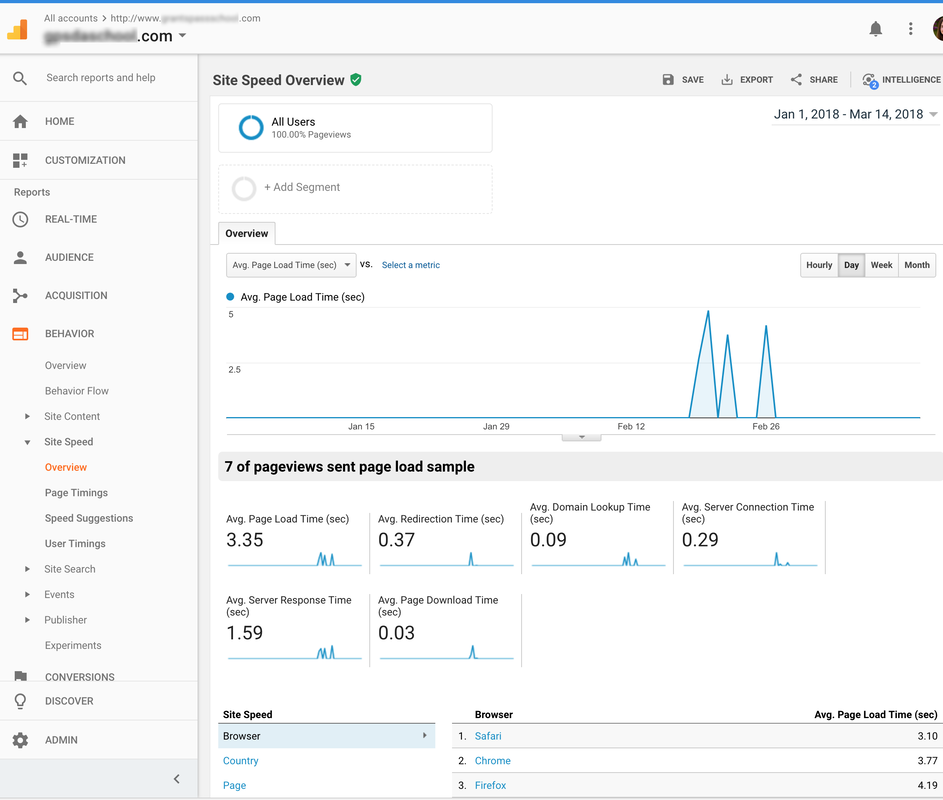
BEHAVIOR—Site Speed—Page Timings

This shows the average load time of each individual page, so you can better pinpoint what pages may be slow and affecting the average site load time.

(You can also run the Screaming Frog SEO Spider tool to determine what elements are affecting page load time, or check Google’s Page Speed Insights tool). 

These Google Analytics overview reports will be most helpful for you as you begin consistent use of this tool.

Getting a big-picture view of how your current audience is interacting with your site can help you identify any “roadblocks” that might be inhibiting users from completing a desired action.
It will also help you plan your future content by revealing which content is inspiring further browsing throughout your site.
 
If you’re interested in a full course on the effective use of Google Analytics, check out Google Analytics Academy, Google’s free resource for Analytics users.
​

Additional Resources:
  • A Guide to the Standard Reports in Google Analytics: Audience Reports
  • How to Get Actionable Data from Google Analytics in 10 Minutes
    ​ (Setting goals and measuring data against your website goals)
  • Google Analytics: Overview & Set-up
  • Web Tracking + Introduction to Google Analytics (downloadable powerpoint)
0 Comments

How to Set Up Google Search Console

1/28/2019

0 Comments


Amy Prindle

The Center for Online Evangelism is a missionary project devoted to developing online mission stations.

​Edits and additions by Jamie Jean Domm

​Monitor how your website interacts with Google searches,
and determine if any errors are preventing users from finding your organization's website. 

1. Go to Search Console and click “Sign In.”
Picture
2. Enter the email address & password associated with your organization’s website
Picture
3. Once you the enter email and password, you will see the welcome page.
Picture
4. First, add the name of your website and then, click “Add a property.
Picture
NOTE: The actual function of adding a property isn’t included in the NEW Google Search Console yet. That’s why Search Console automatically switches back to the old version where you can add your website. (Google Search Console recently updated and is slowly getting rid of the old format. We will provide an updated lesson with newer screenshots when Google permanently removes the old format.)
 
5. Next you'll be asked to verify if you own the website. Since you already have Google Analytics installed and are logged in to the same Google account, you may try the first recommended method of verification/ownership. Hit “Verify,” and then you’ll see a confirmation page.
 
NOTE: If this method of verification does not work, please see the next step for additional instructions. If you are using a CMS other than WordPress, this process will likely need an alternative method of verification.
Picture
6a. Just in case this process needs a few extra steps, it may be a good idea to have your website administrator/developer available for guidance or assistance. Note the recommended methods of verification:

  • HTML file upload—which requires ftp access to your website. Google will give you a file to download, and you will upload that same file to your ftp. Then come back to Search Console and click “Verify.”
  • HTML tag—There are plugins available to assist in this, such as Jetpack or Yoast SEO. This involves adding a meta tag to your site’s homepage. You may add this meta tag straight to your website theme’s header php file, though if you change your theme you’ll need to paste this meta tag back in.
  • Domain name provider—This involves signing in to your domain provider account to upload a file. Google will provide steps to walk you through this process.
  • Google Tag Manager—If you are using Google Tag Manager, you can utilize this process for verification. Tag Manager is not covered in this lesson.
    ​
If you are still having trouble verifying your website for search console, feel free to ask for help at info@centerforonlineevangelism.org.
Picture
6b. For WordPress users who use Yoast SEO we recommend using the HTML tag within the “Alternate methods.” You can easily copy this code and paste it into the “Webmaster tools” tab within the Yoast SEO plugin:
Picture
​Place the copied code in the Google Search Console box. After saving this, you can return to Google Search Console and click on the “Verify” button to confirm. 
Picture
7. Once your website ownership is verified, your Search Console dashboard should look similar to this
Picture
You will have to wait 5-7 days to see any meaningful data. Make sure to check back regularly—set calendar appointments to make sure you don’t forget!
 
After you’ve confirmed that both Analytics and Search Console are properly set up and working, the next chapters will show you how to start using these important tools. 
  • Beginner Tutorial for Google Analytics​​
  • Beginner Tutorial for Google Search Console

If you want to keep learning more, here are some recommended videos:
  • How to Set up Google Search Console (and add a sitemap)
  • How to Increase Your Search Traffic Using Google Search Console​
0 Comments

How to Set up Google Analytics

1/28/2019

1 Comment


Amy Prindle

The Center for Online Evangelism is a missionary project devoted to developing online mission stations.

​Edits and additions by Jamie Jean Domm

How to Set up Google Analytics

Any website worth building is a website worth tracking.

NOTE: The following setup describes how to set up Google Analytics and Search Console for a WordPress website, a highly recommended and widely-used development platform (CMS or Content Management System). If your organization’s website is not a WordPress site, what you see will be slightly different, but overall the process tends to be similar.

Key differences may arise during steps that involve web development, such as applying tracking codes and uploading verification files. If you have questions, contact your CMS or website provider’s technical support, consult the help section of your platform or reach out to your IT team.

Most major platforms will have set instructions for setting up Google Analytics and Search Console. However, it’s a good idea to confirm that your CMS allows the Analytics tracking code to be applied to each page of the website. If not, you miss out on most of the invaluable data of how users navigate your site. Make sure to get a clear answer from the tech support representative.

1.  Sign in to your organization’s Gmail account. 
Picture
2. After you enter in your email and password, go to analytics.google.com to sign up.
Picture
3. Make sure “website” is selected at the top left.
Picture
4. Input your organization’s name in “Account Name”
 
5. Use your website’s domain name for the “Website Name,” e.g., “myministrywebsite.com”
 
6. “Industry Category” is optional but recommended. This enables Google to show you benchmark data from the websites of similar organizations, giving you a general guide for evaluating website performance and setting expectations.
 
7. Enter the time zone of your organization’s primary location. 

8. Before you finish on this page, note the check boxes. There are some data sharing options. You can read through these links and decide if you’d like to share this information with Google’s support team and account specialists. If you don’t want to share any of your analytics data, leave the boxes unchecked.
Picture
9. Click “Get Tracking ID,” and a pop-up screen will ask you to agree to terms of service. You must accept before you continue.
 
You’ll see a screen similar to this:
Picture
​10. The Tracking ID and Website Tracking script (code) you receive will need to be installed on each page of your website in order to start gathering information about how people are navigating your site and to, then, present it in its reports. 

There are several ways to install Google Analytics on your site, and it depends on the type of content management system (CMS) used for your organization’s website. We’ll go through 3 common methods:

1. Installing the code in AdventistChurchConnect or AdventistSchoolConnect 3.0
  • From your ACC dashboard, go to Settings, then Integrations.
  • At the top you’ll see an “Analytics” box. Select “Google Analytics” in the “Type” dropdown menu.
  • A space will show up to enter your Google Analytics ID. This will apply it to the entire site.
Picture
2) Applying the Website Tracking script to your website’s code.
  • If you or your website developer is up for it, you can add this Website Tracking script directly to the theme of your WordPress website.
  • This small javascript code is copied and pasted into your website’s template page before the closing </head> tag.
    • NOTE: Your specific tracking code will replace “UA-XXXX-X”
Picture
3) Using a free WordPress plugin, “MonsterInsites.” (Note: There are several plugins designed for the purpose of applying Google Analytics to your WordPress website, this is just one of the recommended plugins)
  • From your WordPress dashboard, go to “plugins” and “Add New.”
  • Do a keyword search for “MonsterInsights” to find the plugin.
  • Install MonsterInsights and click “activate.”
  • Once activated, there will be a new section in your Admin area called “Insights.”
  • Go to Insights > Settings. You’ll need to authenticate your Google account, which allows Wordpress to communicate with Google and send its site visitor information.
  • To authenticate, make sure you are still logged in to your organization’s Google account. Check that the Gmail address is up at the top right of the pop-up box from MonsterInsights. Click “Allow” and follow the prompts.
  • You can also paste the code in manually. Check the “Manually enter your UA code” box, then go back to your Analytics account, click on the Admin link in the main menu, and then “Property Settings” under the “Property” column. 
  • Copy the code under “Tracking ID” (include the UA portion) and paste the code into the text box in the plugin.
  • Click on “Save Changes” and your site should now be tracking your visitor data.

There are also ways to add your tracking code to Wix, SquareSpace or other CMSs, many of which have instructions in their help sections or can be found with a simple internet search.
 
Now that your code is applied to your site, check back in a few days to make sure everything is working. You should see some activity through most of your webpages, though it will take about 30 days to truly get a picture of the regular activity.
 
Once you have verified that Analytics is successfully installed, then you can install Google Search Console. This essentially submits your website to Google, enabling you to monitor how your website interacts with search engines. It is also a useful tool to check for errors that might keep Google from crawling your site.

Next step blogs:
  • ​How to Set up Search Console
  • Beginner Tutorial for Google Analytics​​
  • Beginner Tutorial for Google Search Console
1 Comment

Constructing Your SEO Foundation—How to Set Up Google Analytics and Search Console

1/28/2019

0 Comments


Amy Prindle

The Center for Online Evangelism is a missionary project devoted to developing online mission stations.

​Edits and additions by Jamie Jean Domm

Constructing Your SEO Foundation Picture
It’s the feedback you’ve always wanted! Finally, you’ll be able to see how your audience is using your website.

This section is all about getting you connected to the right data that will continually fuel your SEO strategy. You no longer have to guess what your audience likes or doesn’t like about your website, your content, your products, etc.

As mentioned in the beginning checklist of SEO fundamentals, if you want to further improve both search-engine-findability and user experience, you first need to see how your website is currently being used.

It can be risky to change a link, move a page, or even change a title or headline without considering how many people are already visiting that page and how they’re getting to it.

The information you get from Google Analytics and Google Search Console (previously called Google Webmaster Tools) helps you quantify specific goals and objectives to include in your overall SEO strategy. You can learn a lot about your audience!

Yes, this is a lot to learn, and it is highly technical. But skip this chapter at your own risk—all the SEO techniques you will learn in the following chapters only work well if your actions are being driven by data from these free, behind-the-scenes tools.

We’ll cover:
  • How to set up Google Analytics
  • How to set up Google Search Console​
  • Beginner Tutorial for Google Analytics
  • Beginner Tutorial for Google Search Console
0 Comments

An Introduction to Facebook Pixels

11/13/2018

1 Comment


Jamie Jean Schneider Domm

Digital Strategist for the North American Division. ​​​​​​​​​

Intro to Facebook Pixels Picture

​What is a Facebook pixel? What are some practical uses for ministry?

Simply put, a Facebook pixel is a small snippet of HTML code that is placed on your website for tracking purposes. It’s similar to Google Analytics, but specifically for Facebook, enabling advertisers to target and re-target more effectively. Installing a pixel allows Facebook to track visitors and categorize them in custom audience groups. This information can help you develop more effective ads that appeal to that specific audience’s interests.

It takes time, effort, and money to attract an audience, so once you have people actively engaging with your content, cultivating your relationship with them is the next most effective step you can take for your ministry. Pixels are one way to re-engage your followers/visitors and ensure that your content is reaching them. It’s also a way to customize the content they receive, taking into consideration their level of engagement and behavior, and making sure your organization’s content stays relevant to their needs.

For example, suppose you have a website that tackles multiple difficult topics, and one of the most visited areas focuses on “What happens when we die?” You can re-target visitors to that specific page with Facebook ads for videos, new content, free books, etc., all related to a biblical perspective on death. You can do the same for your prophecy, health, and Sabbath sections as well.  

Custom audience options for pixels include:
  • All web visitors
  • People who visited specific pages
  • Visitors by time spent
  • Visitors by date

Another practical ministry example: let’s say you are promoting a series of content highlighting health principles, you’re getting a lot of traffic and engagement on your website, but only a few people are taking advantage of the free book offer. A Facebook pixel allows you to re-target these engaged website visitors with a Facebook ad reminder to download or request the free book. This increases your conversion rate (offer downloads) by focusing on people who have already showed interest…but may have gotten distracted by the busyness of work, family, and life. Modern life means people are busy. They may be very interested, but need reminders (remember the “Rule of 7”). This is particularly true when it comes to advertisements for events.

Click here to learn how to set up a Facebook pixel for tracking, a step-by-step guide from Facebook.

Click here for a bonus Christmas event campaign outline using a pixel.
1 Comment

Facebook’s under fire. What does that mean for us?

5/13/2018

0 Comments


​Center for Online Evangelism

The Center for Online Evangelism is a missionary project devoted to developing online mission stations.

Facebook Under Fire Picture

SHOULD WE BE CONCERNED ABOUT OUR FACEBOOK PRESENCE?

Facebook has been all over the news in the last few months, defending itself against mishandling of user data as well as bias in the type of content it favors in its algorithms.

This may lead to some questions of how we should regard and/or use this huge social media platform, a large part of the Online Mission Field.


While we continue to encourage Adventists to spread the Gospel over any social media, to share and support positive, help content and delve into spiritual topics, and even to start online Bible studies or groups, there are always best practices to consider.

But even while following best practices, Facebook could still cause your posts to be buried by their algorithm, or you might find yourself feeling bombarded by strangely-accurate online ads.

But is that a reason to leave Facebook? Is that a reason to stay silent? In most cases, we don’t think so.


There are issues to consider, as well as things we can do to keep our personal information as safe as possible and to conduct ourselves conscientiously. Overall, however, our opportunities for online mission work for individuals, groups, churches, schools, and ministries remain.

We invite you to read sdadata.org’s post, “Why Christians Shouldn’t Leave Facebook” by Jamie Domm, Digital Strategist for the North American Division.

In addition, if you’re concerned about the security of your personal information and what risks might be involved from maintaining activity on Facebook, especially with a spiritual focus, here are a few thoughts:

WHAT'S HAPPENING WITH MY PERSONAL DATA?

As you may have heard from various news channels, Cambridge Analytica came under fire for mishandling Facebook user data with Facebook’s permission. The data ended up being allegedly used by advertisers during political election seasons to create super-targeted advertising meant to influence voter opinion.

And that’s not all. Discussions are ongoing as to how far this user data went—Was it shared to other companies? What are they using it for?

While the best anyone can do at this point is make educated guesses, here’s the bottom line—If yours or anyone else’s user data is retained by a firm like Cambridge Analytica or any other research entity, it’s likely used for marketing purposes.

The better they know your behavior, the easier it is to sell to you.

Knowing a faceless entity out there might have personal information about you is indeed unsettling. That’s why you’ll find piles of advice on what to share or not to share online, in order to prevent identity theft, predatory targeting, etc.

However, just by being online, personal data is collected minute by minute through our location data, browsing habits, search histories, clicks, downloads, Likes, Shares, etc.

But before we get too paranoid, remember that the most common use for all this data is so marketers can better know how to advertise to you. They may not even know your name, address or phone number, but they know that your IP address likes to shoe shop on Zappos.com, share and comment on cat videos, or discuss certain topics on Quora or reddit. (Read more here.)

If a platform is free to use, like Facebook, advertising is footing the bill. And for those advertisers to get the most bang for their buck, they’re going to use the most targeted, intuitive marketing strategies possible to maximize sales. And that means knowing more about what their audience values.  

Truth be told, it’s not entirely different offline. Companies track consumer habits everywhere from the grocery store to Home Depot to your local pharmacy. Ads in the most innocent of places are built upon Big Data in order to convince you to buy.

While there may be a time or two when you feel a bit violated after an accidental click or unintentional social media “rabbithole” can result in a few sponsored posts you’d rather not see or have associated with you, at least we still have the free agency to choose not to click on that ad and scroll right past. (Advertisers will eventually notice that, too.)

WHAT PRECAUTIONS CAN I TAKE?

Even so, it’s never a bad idea to be extra savvy in how you represent yourself online. You can be selective about the social platforms you participate in, and set both your browser’s and your social profiles’ privacy settings conservatively.

You can also put extra care into how much you share about your preferences in sports, politics, spirituality, business or other hotly debated topics, and whether or not you draw attention to your travels, your family play-by-plays, your big purchases, etc.

There are also browser extensions and apps that can block adware, pop-ups, and detect some website trackers (Avast, AdBlock, Privacy Badger, Ghostery, etc.).

All in all, the Center for Online Evangelism recommends we always be conscientious about how we continuously represent ourselves, our families, and our communities online. We can’t tell everyone exactly what to share or not to share, as every individual has their own priorities, sensitivities, and life situations. All we can do is promote proven best practices and keep you aware of what could be amazing opportunities as well as (and sometimes simultaneously) considerable threats in the online world.

When it comes to Facebook, do keep up with news reports from your trusted channels. The issues about privacy, user data, bias, and algorithms will likely be ongoing discussions.
But as Christians actively spreading the Gospel to every nation, kindred and tribe, why not keep right on connecting, discussing, promoting, helping and sharing on Facebook right up until Jesus comes, or we’re booted from the platform. Whichever happens first.
Reposted with permission from centerforonlineevangelism.org.
0 Comments

UTM Codes: A Guide to Creating Your Own

6/1/2017

0 Comments


Jamie Schneider

Digital Strategist for the North American Division.

If you can track it, you can measure it. Thus, you can better understand your audience and their behavior to adapt your strategies accordingly to more effectively reach them. This saves both time and money while maximizing impact.
UTM Tracking & Measuring
The good news is that creating trackable links is surprisingly easy to do.

What is a UTM code?
UTM = Urchin Tracking Module
https://www.ittoshow.com/?&utm_campaign=NADnow-2017&utm_source=Social-Media

UTM codes are segments appended to the end of a URL that enables data platforms like Google Analytics to record information about website visitors and traffic sources. This is vital for social media managers as it enables you to measure and prove social media success! Or identify problems and adjust your strategies. 
Picture
UTM codes can be used in links shared via:
  • Social Media posts
  • Email
  • Online Ads
  • Websites
  • Any link that drives traffic to your website
 
Creating Your Own:
There are essentially four building blocks of a trackable link.
  1. The URL you want to direct people to
  2. A ? to signify the start of the UTM codes
  3. The name of the promotional campaign the link is related to
  4. The source which is where the link will be used
Picture
Example:

URL = https://www.adventistlearningcommunity.com/faith-reason-earth-history
Campaign = FaithReasonEarth-2017
Source = Social-Media

Put it all together using this formula:
Regular link + ? + Campaign (what event, month, where, etc.) + Source (channel/platform)

Final result:
https://www.adventistlearningcommunity.com/faith-reason-earth-history?&utm_campaign=FaithReasonEarth-2017&utm_source=Social-Media

Be sure to always test your links!
Picture

After you create your trackable link, always test your link before using it to make sure it works. There is nothing worse than sending out a bunch of digital content with a broken link.
 
Gathering the Data:
Now that you know how to append UTM codes to links, let’s see how that information then connects to the data in Google Analytics.
Picture
Google Analytics is a free and essential tool for monitoring and understanding how visitors interact with your website and where they come from. Learn more about how to set it up and specific key terms and metrics here.

As communicators, we want to know what is working and what is not working to drive people to our website. In Google Analytics, we can find important data on channels under Acquisition Overview. This is where those UTM codes (trackable links) come in! In the below example for Is This Thing On, we can see that trackable links accounted for 90.9% of the traffic to the website, meaning that our campaign was a huge driving factor behind awareness and traffic. Keep in mind that OTHER represents links with tracking codes or campaigns.
Picture

The channel breakdown is as follows:
  • Other = UTM Codes or Campaigns
  • Direct (visitors typed in the URL)
  • Social Media (no tracking code)
  • Referral from another website
  • Search engine (example: Google, Bing, etc.)

Campaign Performance:
When we drill down deeper under campaigns, we can learn what aspects of the campaign performed the best by using unique UTM campaign names for the different components of our communications strategy. Google Analytics automatically picks up the campaign name and source from the links. No need to do anything in Google Analytics to make this work! Just be consistent with the UTM codes your use and clear with your campaign and source names.

In the below example, we can see that the biggest driving factor behind campaign traffic was the paid ads. Next was the Facebook event link.
Picture
Picture

We hope this post was helpful! Comment and ask your questions below.

Tweet your post requests with #DigitalEvangelism.

0 Comments
<<Previous

    Archives

    August 2020
    July 2020
    June 2020
    April 2020
    March 2020
    February 2020
    December 2019
    November 2019
    August 2019
    July 2019
    June 2019
    May 2019
    April 2019
    March 2019
    February 2019
    January 2019
    December 2018
    November 2018
    October 2018
    September 2018
    July 2018
    June 2018
    May 2018
    April 2018
    March 2018
    February 2018
    January 2018
    December 2017
    November 2017
    October 2017
    September 2017
    July 2017
    June 2017
    May 2017
    April 2017
    March 2017
    February 2017
    January 2017
    December 2016
    November 2016
    October 2016

    Categories

    All
    A Allan Martin
    Adam Fenner
    Angeline Brauer
    Big Data
    Center For Online Evangelism
    Chris Matts
    Culture
    Data Science
    Data Tracking
    David Mwansa
    Design
    Digital Discipleship
    Digital Pew
    Digital Strategies Intern
    Dustin Comm
    Email Communications
    Erica Jones
    Event Registration
    Faith-hoyt
    Fundraising
    General
    Harvey Alférez
    Heidi Baumgartner
    James Gigante
    Jamie Schneider
    Jason Alexis
    Justin Khoe
    Kaleb Eisele
    Kimberly Luste Maran
    Marketing
    Member Care
    Michelle Diedrich
    Nick Wolfer
    Online Church
    Paul Hopkins
    Philanthropy
    Rachel Lemons Aitken
    Reaching Young Adults
    Rodney Brady
    SEO
    Social Media
    Stewardship
    Text Evangelism
    Video
    Volunteering
    Website
    Working From Home

    RSS Feed

Location

Hiding within those mounds of data is knowledge that could change the life of a patient, or change the world.

Atul Butte, Researcher
University of California, San Francisco

Contact Us

    Subscribe Today!

    We will use this email to send you updates on social media and big data initiatives.
Submit
Legal Notice   l   Privacy Policy
  • Home
    • Big Data
    • Social Media
  • BLOG
  • RESOURCES
    • RESOURCE MENU >
      • ADVENTIST IDENTITY GUIDELINES
      • BIG DATA RESOURCES
      • BRANDING, IMAGE & DESIGN RESOURCES
      • CHURCH/MINISTRY SPECIFIC RESOURCES
      • COPYRIGHT & TRADEMARK BASICS
      • COURSES
      • EMAIL RESOURCES
      • GUIDANCE FOR HIRING SOCIAL MEDIA POSITIONS
      • PODCASTS
      • REPORTS & CASE STUDIES
      • SOCIAL MEDIA RESOURCES
      • (SOCIAL) VIDEO RESOURCES >
        • HOW TO START A VIDEO MINISTRY
      • TEXTING 4 CHURCHES
      • TRACKING & ANALTYICS
      • WATCH VIDEOS & TUTORIALS
      • WEBSITE TIPS
    • SOCIAL MEDIA GUIDELINES
  • SEO
    • SEO TERMS
  • Digital Discipleship & Evangelism
  • COVID-19 RESOURCES
  • eNEWSLETTER