Jamie Schneider Digital Strategist for the North American Division. Google Analytics is a free and essential tool for monitoring and understanding how visitors interact with your website and where they come from. This blog post will give you a quick tour and highlight some important terms and features. It is very easy to set up:
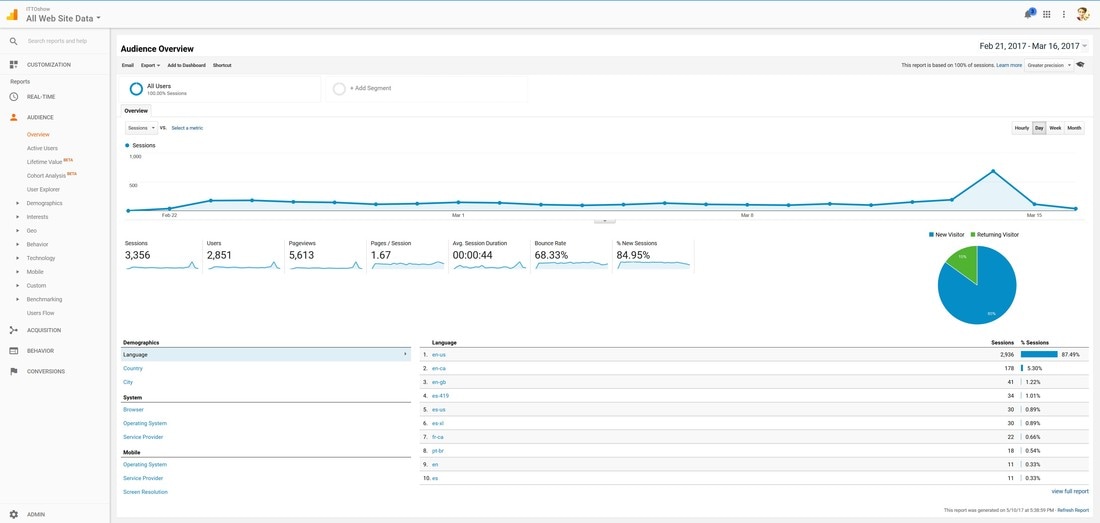
When you open your Google Analytics account, you’ll see your Audience Overview report. In the top right, you can change the date range. In the center, you can see the data for the various terms above. On the left-hand side is the main navigation. Avoid Data Paralysis: Time is valuable. Don’t get so caught in the details or data that you never move forward, or respond too late and miss an important opportunity. Prioritize based on your goals; you don’t have time to track everything! Most non-profits do not have the luxury of a dedicated analytics team. But you don’t need to dive too deep to get valuable information about how your website and campaigns are performing. Here are the key metrics to monitor that won’t overwhelm you, but will maximize your data-driven decision making. Audience metrics:
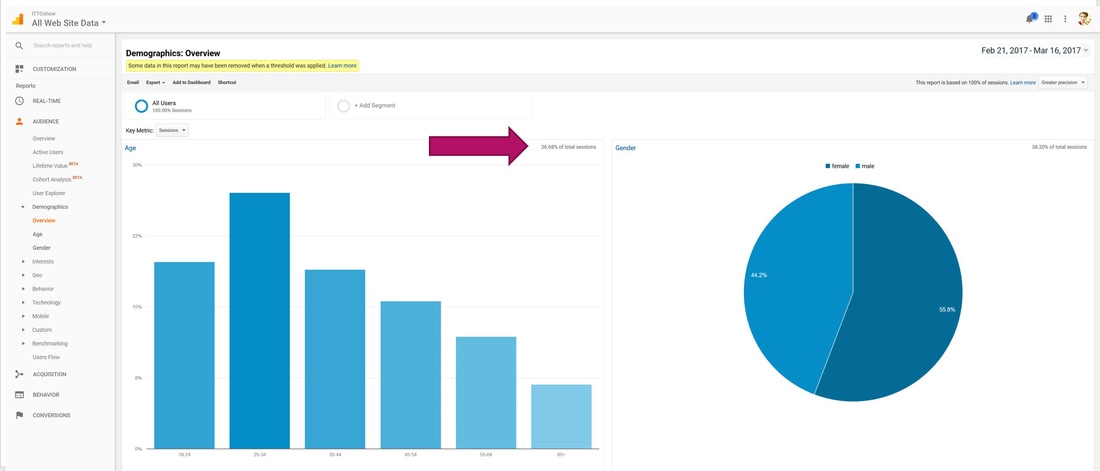
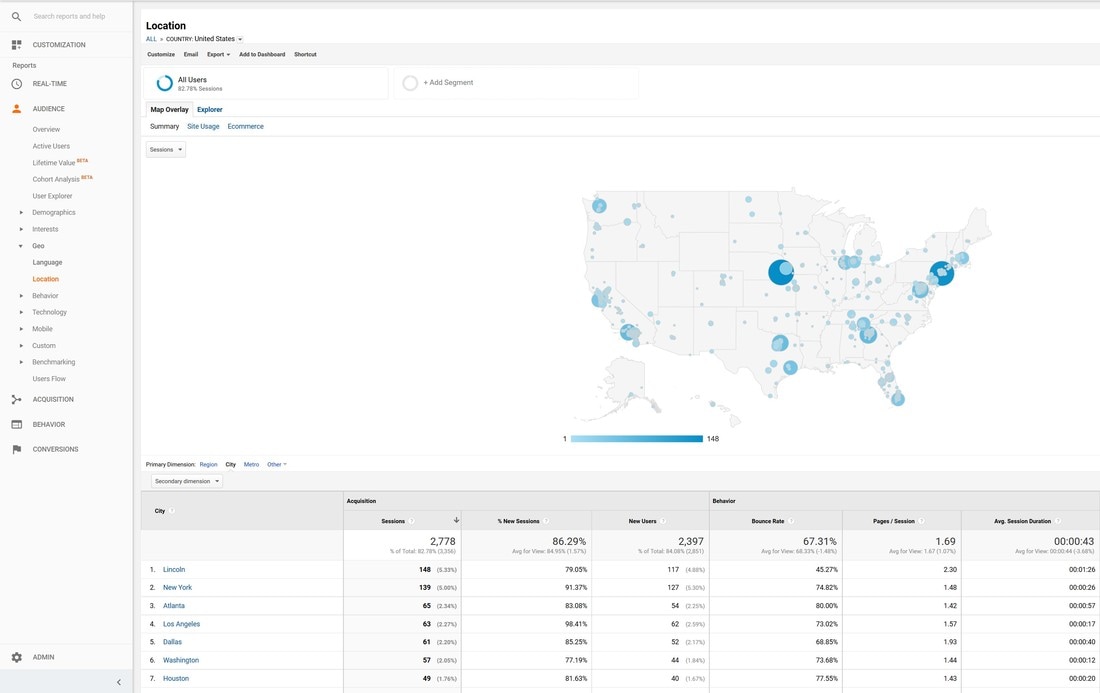
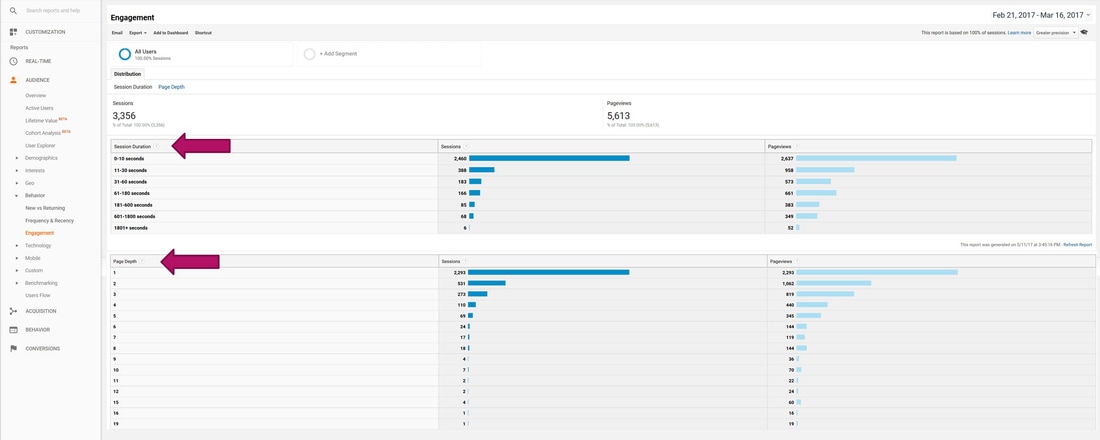
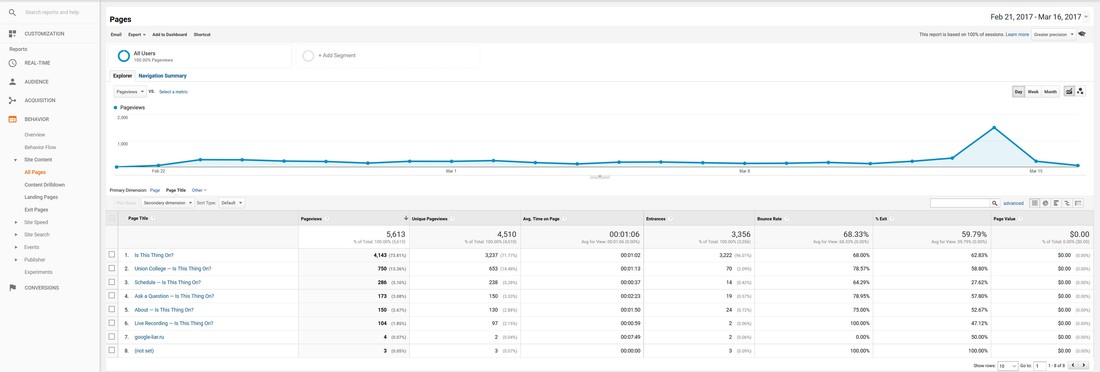
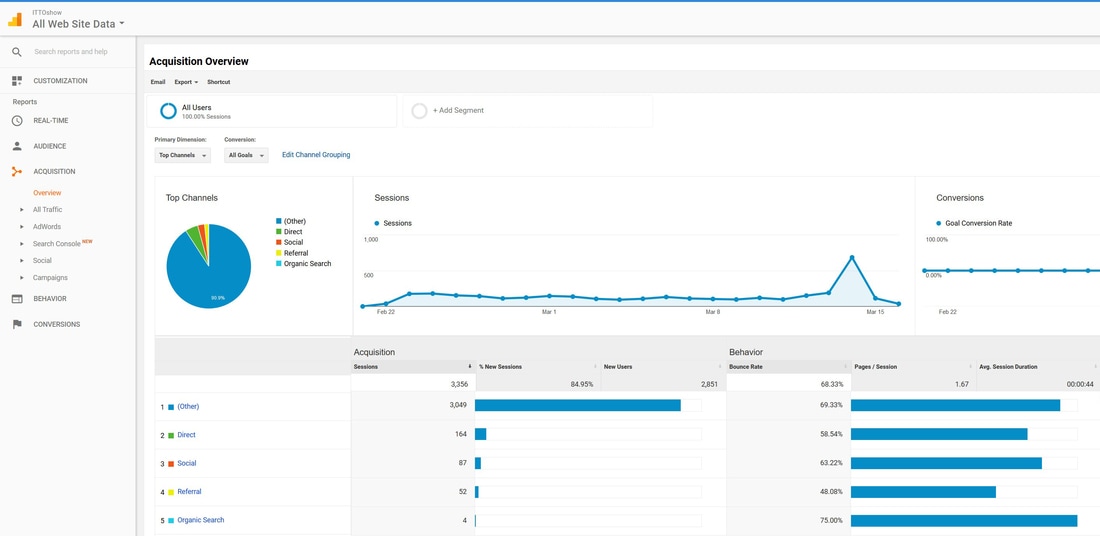
Age & Gender Under demographics you can view known age & gender. In the below example, only 36.68% of total sessions have corresponding demographic data. Even though the data is incomplete, it does give a pretty good cross-section of who is visiting the website. Location You can see location by country, city, state, and metro area. You can also look at language if that is relevant to your ministry. In addition, you can analyze the number of sessions and users as well as their behavior such as bounce-rate, pages per session or depth-of-session and average session length. Engagement Length of visit/depth of visit. Behavior – Site Content Here you can determine your most popular and least popular pages. Acquisition - Traffic Sources As communicators, we want to know what is working and what is not working to drive people to our website. In Google Analytics, we can find important data on channels under Acquisition Overview. This is where UTM codes come in! In the below example for Is This Thing On, we can see that trackable links accounted for 90.9% of the traffic to the website, meaning that our campaign was a huge driving factor behind awareness and traffic. Keep in mind that OTHER represents links with tracking codes or campaigns. Click here to learn more about UTM codes. The channel breakdown is as follows:
When we drill down deeper under campaigns, we can learn what aspects of a campaign performed the best by using unique UTM campaign names for the different components of our communications strategy. Google Analytics automatically picks up the campaign name and source from the links. No need to do anything in Google Analytics to make this work! Just be consistent with the UTM codes you use and clear with your campaign and source names. In the below example, we can see that the biggest driving factor behind campaign traffic was the paid ads. Next was the Facebook event link. And that is our quick intro to Google Analytics! Remember to:
Ask your questions below or tweet using #DigitalEvangelism. 5/4/2023 02:42:13 am
I've never tried setting it up. Want to know how. Comments are closed.
|
Archives
August 2020
Categories
All
|
- Home
- BLOG
-
RESOURCES
-
RESOURCE MENU
>
- ADVENTIST IDENTITY GUIDELINES
- BIG DATA RESOURCES
- BRANDING, IMAGE & DESIGN RESOURCES
- CHURCH/MINISTRY SPECIFIC RESOURCES
- COPYRIGHT & TRADEMARK BASICS
- COURSES
- EMAIL RESOURCES
- GUIDANCE FOR HIRING SOCIAL MEDIA POSITIONS
- PODCASTS
- REPORTS & CASE STUDIES
- SOCIAL MEDIA RESOURCES
- (SOCIAL) VIDEO RESOURCES >
- TEXTING 4 CHURCHES
- TRACKING & ANALTYICS
- WATCH VIDEOS & TUTORIALS
- WEBSITE TIPS
- SOCIAL MEDIA GUIDELINES
-
RESOURCE MENU
>
- SEO
- Digital Discipleship & Evangelism
- COVID-19 RESOURCES
- eNEWSLETTER





 RSS Feed