Harvey Alférez, Ph.D Data Scientist, School of Engineering and Technology, Montemorelos University, Mexico 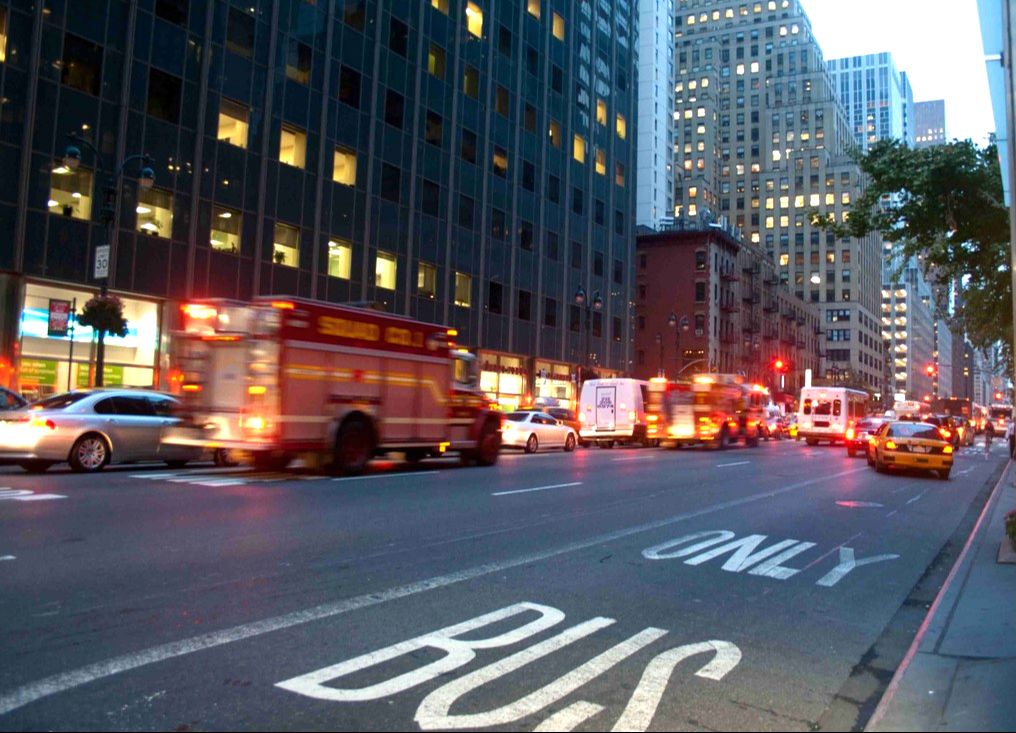 Traffic in NYC as captured by my wife Doris’ camera lens There is tons of open data on the Web. This data can be freely used by Seventh-day Adventists to try to figure out ways to help the inhabitants in the cities. This post describes how the students at my Pattern Recognition course at Montemorelos University and I have used open data and machine learning, which is a key component of data science, to discover interesting mission-oriented patterns for the church at NYC. In my courses, I mostly focus on analyzing open data from NYC because of two reasons: 1) NYC has pivotal significance in our church’s ongoing Mission to the Cities project; and 2) NYC provides a portal that makes the wealth of public data generated by various NYC agencies and other city organizations available for public use [1]. Although the number of traffic deaths in NYC has fallen [2], city officials and traffic-safety groups agree that more aggressive steps must be taken to reach Mayor Bill de Blasio’s goal of eliminating traffic deaths in the city [3]. With this problem in mind, we analyzed a dataset of motor vehicle collisions in NYC, which is freely provided by the Police Department [4]. The studied dataset was created in 2014 and subsequently updated in 2016. This dataset registers motor vehicle collisions in Bronx, Brooklyn, Manhattan, Queens, and Staten Island from 2014 to 2016. This is a large dataset with 932,904 registered incidents! Moreover, each registered incident has 30 variables. With traditional queries and spreadsheet analysis it is quite difficult (and sometimes impossible) to obtain timely answers to unseen patterns in large quantities of data, such as in our case study. In this kind of cases, machine learning, which “gives computers the ability to learn without being explicitly programmed” [5], can help us to grasp patterns we did not know that even exist. From the set of 30 variables, we chose a subset to carry out the experiments. First, we chose the variables Date and Time because we wanted to know the day and time of each traffic incident. The Zip Code, Borough, Longitude, and Latitude variables were chosen because we wanted to know the demographic information of the accidents. Also, we had interest in figuring out the demographic groups that were injured the most. Therefore, we included in the experiments the Injured Persons, Injured Pedestrians, Injured Motorists and Injured Cyclists variables. Last but not least, we wanted to determine what provoked the accident and the type of vehicle that caused the accident. Therefore, we chose the Contributing Vehicle 1 and the Vehicle Type Code 1 variables from the dataset. In order to analyze the data, we used Weka, which is a powerful tool for machine learning [6]. Although Weka contains a large range of machine learning algorithms, for our exploration we used the K-Means algorithm because the input data is unlabeled. Our findings are as follows:
I thank the students at my Pattern Recognition course, Anthony, Claudia, Carlos, Isaías, Jairo, Eduard, Marco, Jaziel and Carlos, for their intense work on the experiments.  References: 1. The City of New York, “NYC Open Data,” (n.d.), https://data.cityofnewyork.us. 2. E. G. Fitzsimmons, “Number of Traffic Deaths in New York Falls for a Second Straight Year,” (2016), http://www.nytimes.com/2016/01/02/nyregion/number-of-traffic-deaths-in-new-york-falls-for-a-second-year-in-a-row.html. 3. M. Flegenheimer, “De Blasio Outlines Steps to Eliminate Traffic Deaths,” (2014), https://www.nytimes.com/2014/02/19/nyregion/de-blasio-unveils-plans-to-eliminate-traffic-deaths.html. 4. NYPD, “NYPD Motor Vehicle Collisions,” (2014), https://data.cityofnewyork.us/Public-Safety/NYPD-Motor-Vehicle-Collisions/h9gi-nx95. 5. P. Simon, Too Big to Ignore: The Business Case for Big Data (Hoboken, NJ.: Wiley, 2013). 6. The University of Waikato, “Weka 3: Data Mining Software in Java,” (n.d.), http://www.cs.waikato.ac.nz/ml/weka/.
Angie
1/6/2017 08:53:40 pm
Well done! This is a great example of how the Church can respond better to the needs of their surrounding societies.
Jamie Schneider
1/7/2017 09:44:57 pm
Thanks! Good suggestion. 10/10/2022 02:34:13 pm
Also, we had interest in figuring out the demographic groups that were injured the most. Therefore, we included in the experiments the Injured Persons, Injured Pedestrians, Thank you for sharing your great post! 2/13/2023 06:33:27 am
We had interest in figuring out the demographic groups that were injured the most. Therefore, we included in the experiments the Injured Persons, Injured Pedestrians, Injured Motorists and Injured Cyclists variables. Thank you for making this such an awesome post! 3/31/2023 02:14:40 pm
Also, information boots could be on display with pamphlets offering cycling safety tips to avoid collisions as well as what to do if people get involved in a traffic accident. Thank you for the beautiful post! 4/29/2023 07:37:50 am
We had interest in figuring out the demographic groups that were injured the most. Therefore, we included in the experiments the Injured Persons, Injured Pedestrians, Injured Motorists and Injured Cyclists variables. I truly appreciate your great post! 5/3/2023 07:32:15 am
Such an interesting post. Thanks for sharing this one! 6/15/2023 09:10:52 am
As shown in the results above, big problems could have implementable simple solutions in which church members could make an extraordinary difference in their communities. Thank you for sharing your great post! 7/5/2023 12:23:57 pm
As shown in the results above, big problems could have implementable simple solutions in which church members could make an extraordinary difference in their communities. Thank you for making this such an awesome post! 12/10/2023 05:01:33 pm
Harvey Alférez's exploration of open data and machine learning for mission-oriented patterns in New York City is inspiring. It's a testament to the evolving landscape of data science and its potential to address critical societal issues. Comments are closed.
|
Archives
August 2020
Categories
All
|
- Home
- BLOG
-
RESOURCES
-
RESOURCE MENU
>
- ADVENTIST IDENTITY GUIDELINES
- BIG DATA RESOURCES
- BRANDING, IMAGE & DESIGN RESOURCES
- CHURCH/MINISTRY SPECIFIC RESOURCES
- COPYRIGHT & TRADEMARK BASICS
- COURSES
- EMAIL RESOURCES
- GUIDANCE FOR HIRING SOCIAL MEDIA POSITIONS
- PODCASTS
- REPORTS & CASE STUDIES
- SOCIAL MEDIA RESOURCES
- (SOCIAL) VIDEO RESOURCES >
- TEXTING 4 CHURCHES
- TRACKING & ANALTYICS
- WATCH VIDEOS & TUTORIALS
- WEBSITE TIPS
- SOCIAL MEDIA GUIDELINES
-
RESOURCE MENU
>
- SEO
- Digital Discipleship & Evangelism
- COVID-19 RESOURCES
- eNEWSLETTER
 RSS Feed